CEMB USA C75SE (C) User Manual
Page 25
I 0322 - 24
I 0322 - 25
GB
GB
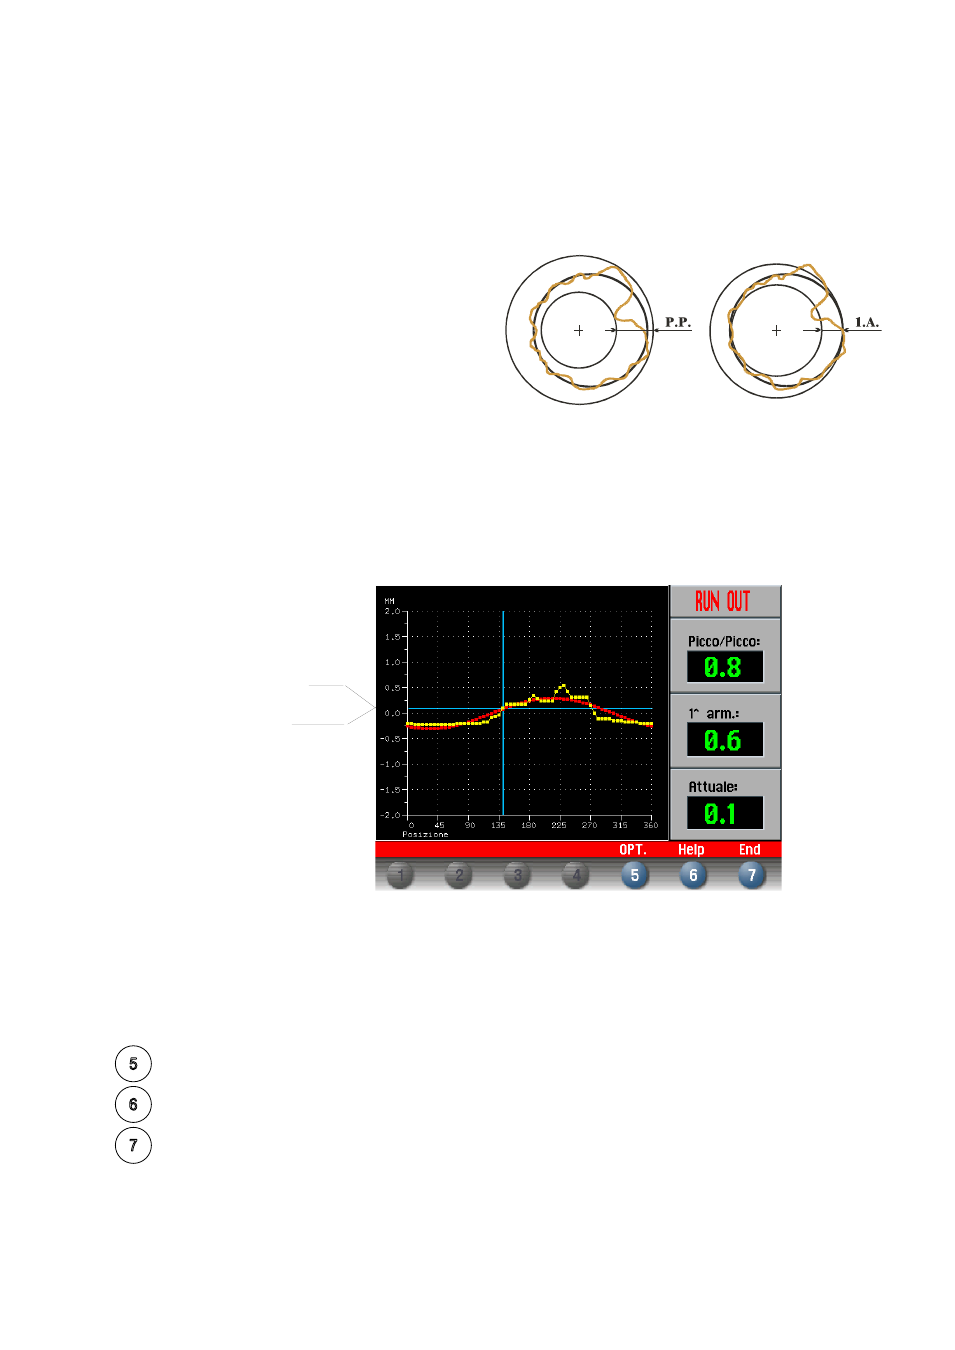
5.8 - ECCENTRICITY MEASUREMENT (OPTIONAL)
The much enlarged figures show the outer tyre surface and axis of wheel rotation.
Fig. A - shows measurement of the total Peak-to-Peak eccentricity defined as maximum radial deviation
of the tyre surface.
Fig. B - shows measurement of the eccentricity of
the 1st harmonic, i.e. the eccentricity of that circle
which “recopies” the tyre shape, by averaging the
local deviations of the tyre from the round shape.
Obviously the P.P. measurement is normally greater
than that of the 1st harmonic. Tyre manufacturers
normally supply two different tolerances for the two
eccentricities.
At the end of the balancing spin it is possible to automatically measure the eccentricity of the tyre through the
SONAR sensor installed on the guard. The sensor should be positioned by hand in front of the tyre tread.
GRAPH 1 : represents the actual Peak-to-Peak eccentricity.
GRAPH 2 : represents the eccentricity of the 1st harmonic. For a wheel in optimum conditions, such
graph should approach a straight line.
While rotating the wheel, the screen cursor indicates the current value, with the stage referred to the
eccentricity measurement sensor.
The following buttons are enabled:
: Start an eccentricity optimisation procedure (see
ECCENTRICITY OPTIMISATION)
.
: A box is displayed indicating the offset effect that that eccentricity of the first harmonic measured
may have, at an average speed of 120 Km/h.
: Return to measurement screen.
GRAPH 1 - (yellow)
GRAPH 2 - (red)
Fig. A
Fig. B