Sr785 dynamic signal analyzer – Atec Stanford-Research-Systems-SR785 User Manual
Page 4
or frequency data, stored files, constants, or a rich array of
supplied operations including arithmetic functions, FFT,
inverse FFT, j
ω
, d/d
ω
, exp, ln x and many others. All of the
averaging modes are available as user math operands. Unlike
many other analyzers, the SR785's measurement rate is
virtually unaffected when user math is selected. For instance,
the function exp(ln(conj(FFT2/FFT1))) can be calculated with
a 100 kHz real-time bandwidth.
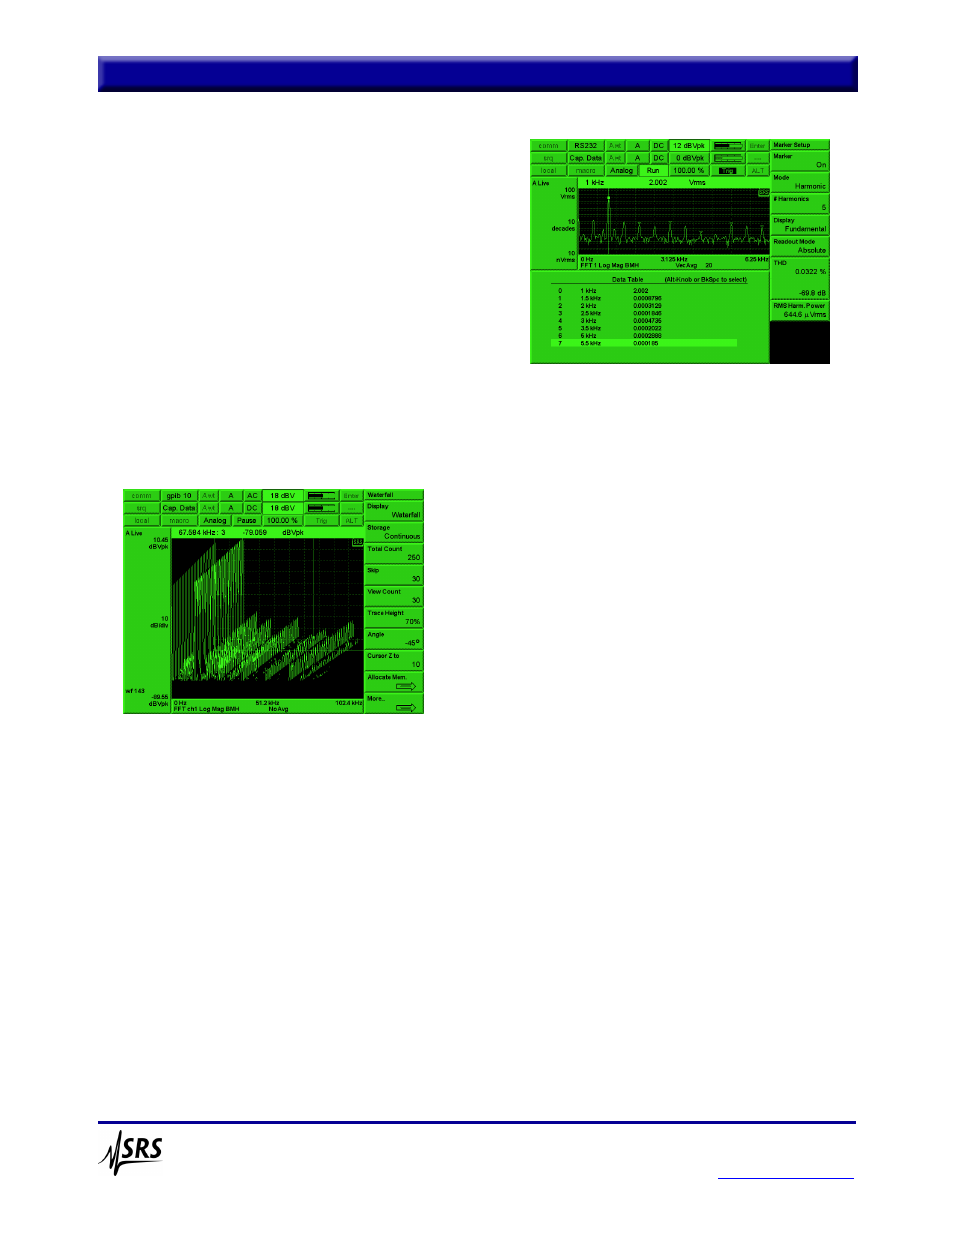
Waterfall
Waterfall plots are a convenient way of viewing a time history
of your data. Each successive measurement record is plotted
along the z-axis making it easy to see trends in the data. All
FFT, octave and order tracking measurements can be stored in
the SR785's waterfall buffer memory. You can choose to save
all measurements and averaging modes, or just the current
measurement to conserve memory. Waterfall traces can be
stored every n time records for FFT and order tracking
measurements. For order tracking measurements, new records
can be acquired at a specific time interval or change in rpm. In
octave measurements, the storage interval is in seconds (as
fast as every 4 ms). While displaying waterfall plots, you can
adjust the skew angle to reveal important features, or change
the baseline threshold to eliminate low-level clutter. Any
z-axis slice or x-axis record can be saved to disk or displayed
separately for analysis.
Analysis
The SR785 includes a wide variety of analysis features.
Marker analysis lets you measure the power contained in
harmonics, sidebands or within a given band of frequencies.
Important information such as THD, THD+N, sideband power
relative to a carrier, or total integrated power are calculated in
real time and displayed on the screen. The front/back display
feature allows you to view live data from both signal inputs on
one graph. You can also simultaneously display saved traces
and live data. The peak-find marker allows you to quickly
locate frequency peaks with the click of a button. The marker
statistics feature calculates the maximum, minimum, mean
and standard deviation of data in any section of the display.
For modal analysis, the cursor can be configured to display the
resonant frequency and damping of a single selected mode.
Data tables are used to display up to 100 selected data points
in tabular format. Limit tables let you to define up to 100 upper
and lower limit segments in each display for GO/NO-GO testing.
Curve Fit and Synthesis
The SR785 has a 20-pole/20-zero curve fitter that can fit
frequency-domain data from both the FFT and swept-sine
measurement groups. Curve models can be displayed in
pole/zero, pole/residue and polynomial formats. Synthesis
reverses the process; enter a model in any of the above formats
and the SR785 synthesizes the required curve. The curve-
fit/synthesis menu allows you to change gain, delay and
frequency scale, set pole and zero locations, and instantly see
the response of the modeled system.
Output
The SR785's 3.5" disk drive, computer interfaces (GPIB and
RS-232), and printer port provide flexibility when saving,
printing and exporting data. Data can be saved in binary or
ASCII formats, and displays can be printed/plotted to any of
the ports or the disk drive. Supported formats include PCL
(LaserJet/DeskJet), dot-matrix, postscript, HP-GL, PCX or
GIF. An annotation editor lets you add text, time, date and file
names to any part of the plot.
Data Conversion Utilities
The SR785 comes with a complete suite of data conversion
utilities for both Windows and DOS operating systems.
SR785 files can be converted to ASCII for use with
spreadsheets, or Universal File Format (UFF) and HP SDF for
use with modal analysis programs. SR785 files can also be
converted to MAT file format for use with MATLAB.
Conversion from external file types is also supported. Both
HP SDF and SR780 files can be converted to SR785 format.
SR785 Dynamic Signal Analyzer
Stanford Research Systems
phone: (408)744-9040
Total harmonic distortion (THD)
Waterfall plot