Atec Acterna-DTS300 User Manual
Page 4
The Analyzer offers 9 to 13 main displays from which to
view and analyze transport stream contents and statistics.
Users can access all displays with a single mouse click and
view statistics in standard and graphical formats. Each display
also lists related events as they occur on the transport stream
in real time. Displays include:
• Summary view
• PID information view
• PID watch view
• Program/Channel view
• Network view (DVB only)
• MPE IP view (DVB only)
• Timing view
• Terrestrial MIP view (DVB only)
• ETR 290/Monitoring view
• CA hierarchical views
• PSI/SI/PSIP table hierarchical views
• Private table hierarchical views
• OpenTV carousel hierarchical views (optional)
Customized Analysis
Users can create customized preferences to tailor the analysis
process to meet the requirements of a specific test scenario
or level of user expertise. Each set of customized preferences
can be saved as a profile, so a single Analyzer can be quickly
configured to meet the requirements of multiple testing
scenarios. The user customizes the analysis process by:
• Defining alarm settings and rate thresholds for monitoring
• Defining reports for validation and acceptance testing
• Selecting the data to be displayed and choosing its format
• Scheduling and defining trigger captures and event logging
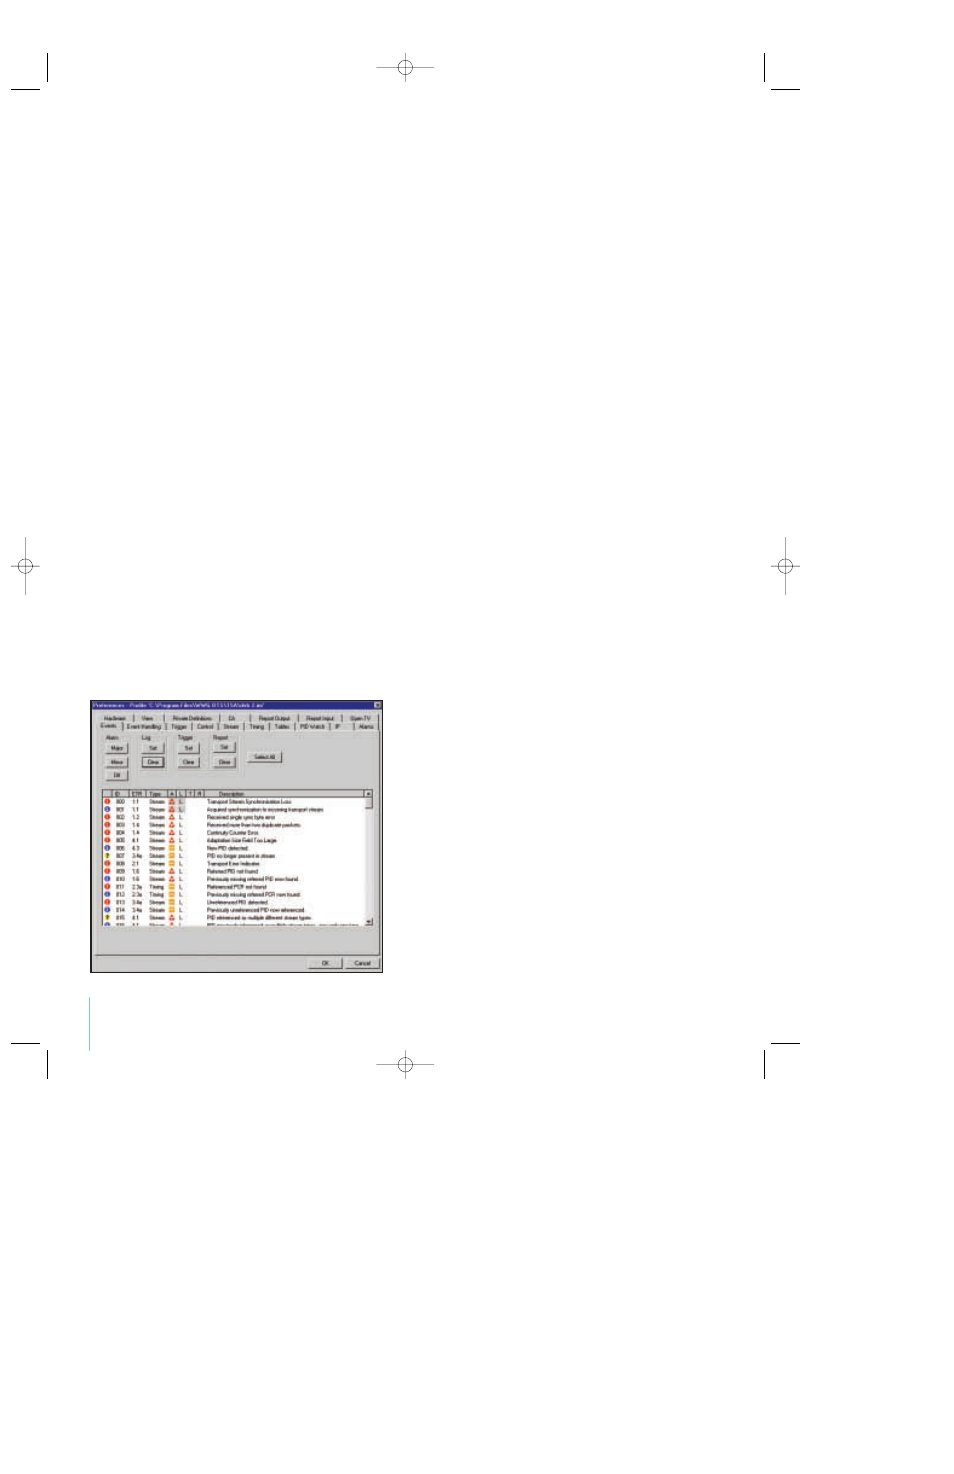
Events Configuration
The Analyzer logs events in real time as they occur on the
transport stream. The user completely customizes this
process by selecting the events to be tracked and choosing
the type of alarm each event will generate. From a single
preferences dialog box, the user determines event settings
and selects which events will generate reports and trigger
captures.
User-Defined Thresholds
The Analyzer’s flexible design allows users to set alarm-
generating thresholds to fit the requirements of a specific
test scenario. Users set thresholds for:
• Table repetition rates
• PCR spacing and jitter
• PID rates (Mbps)
• CA key change rates
Customized Trigger Captures and Post-Processing
The Analyzer performs customizable trigger captures, which
allow users to study sporadic or hard-to-diagnose problems
that occur on the transport stream. When these problems
occur, the Analyzer automatically captures the surrounding
portions of the transport stream, collecting timing informa-
tion with the data to enable replay at the original incoming
data rate, including synchronization variations. Captured
files can be post-analyzed and played back into a network or
system with the Generator.
Customized Reports
To chronicle system performance for baselining and accept-
ance testing or to document problems that appear in the
transport stream, the Analyzer generates user-customized
reports on command. The creation of these reports can be
triggered by:
• Events that occur in the transport stream
• A user-defined schedule
• A manual toolbar button
3
Event Listing and Control
DTS-300 Data.7/01 8/24/01 10:33 AM Page 5