Terrasas – Atec Elgar_TerraSAS User Manual
Page 3
858.458.0223
TerraSAS
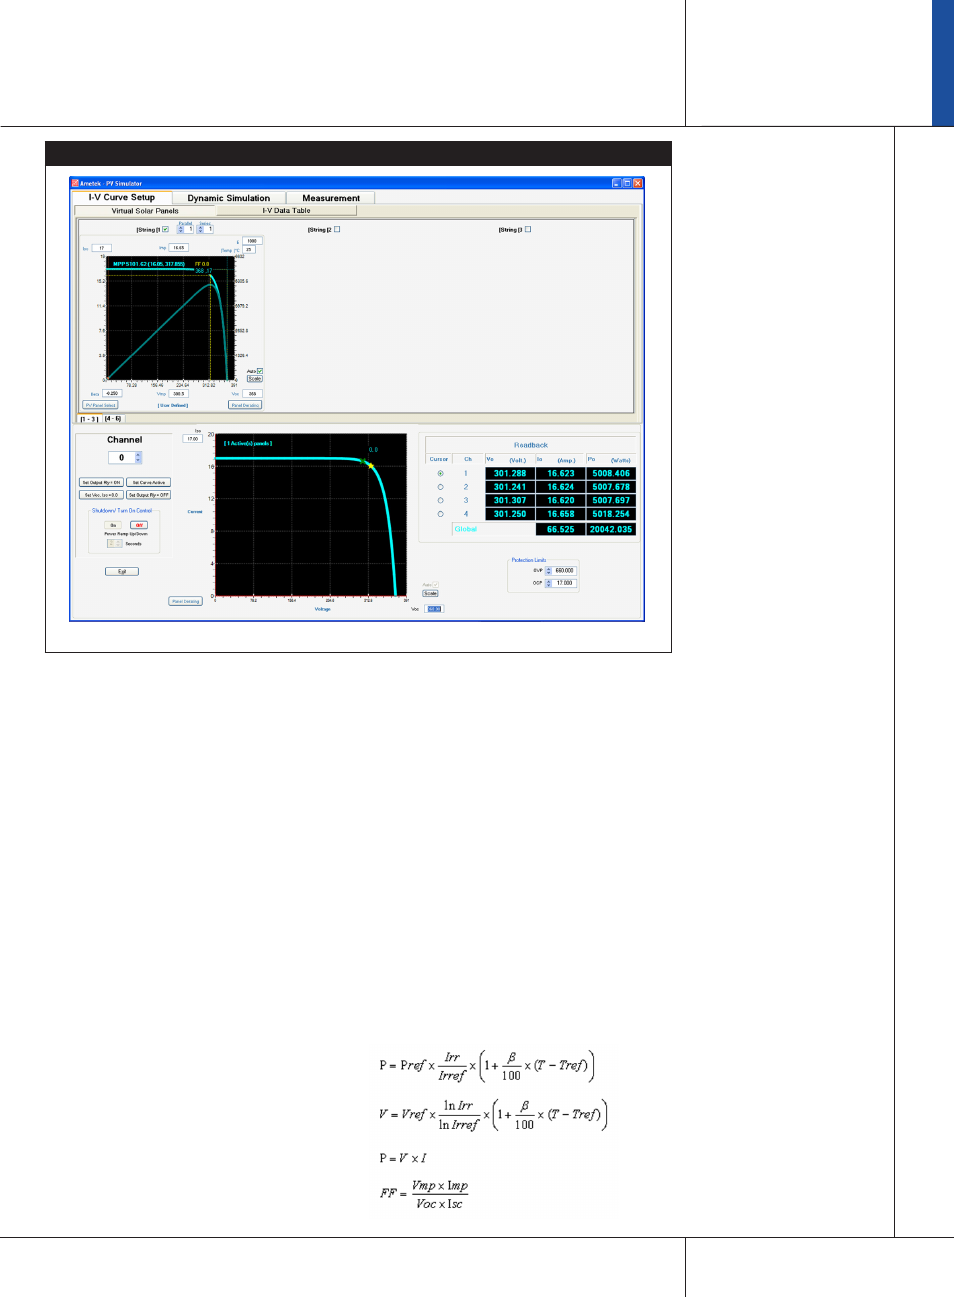
IV Curve Control Interface : Parameters are programmable through sliding scale or direct input of value
Control Displays
The graphic above shows the GUI interface
displays. The entered set of IV curves is displayed
as soon as the parameters are entered. The actual
measured data is then overlaid on the screen so
that the operating point can be viewed in real
time. The display times can be set from minutes
to days to allow for long term testing.
Programmable Parameters
Set a specified irradiance level
Set a specified temperature value
Set a specified voltage level
Set a specified current level
Set a specified temperature coefficient
Ramp of voltage, temperature or irradiance level
over a programmed time interval Readback of
voltage, current, irradiance level, and temperature
setting Programmable calibration of system
Curve Formula
The PV curves for the simulator are derived from
the formula shown below.
Io as a function of Vo:
Io=Isc (1-C1 (exp (V/(C2 x Voc))-1))
C1=(1-(Imp/Isc)) (exp(-Vmp/(C2 x Voc)))
C2=((Vmp/Voc)-1)/(ln(1-Imp/Isc))
Where the Reference Irradiance conditions for the
simulated arrays is 1000W/m2 and the Reference
Array Temperature is 25°C
The simulated PV arrays are provided in terms of
array fill factor, Maximum Power Point Voltage
and Maximum Power Point Power. The curves
generated are based on the Sandia Labs simplified
PV Array model defining the relationship between
these values and other parameters as provided
below:
Where:
3