Xylem Lab 860 User Manual
Page 25
Lab 860
Operation
25
ba75554e05
01/2010
Displaying the
calibration data
You can display the data of the last calibration (see page 36).
Subsequently, you can transmit the displayed calibration data to the
interface, e. g. to a printer or PC, with the
_
> key.
Note
The calibration record is automatically transmitted to the interface after
calibrating.
Sample record:
Calibration evaluation
After calibrating, the meter automatically evaluates the calibration. The
zero point and slope are evaluated separately. The worse evaluation of
both is taken into account. The evaluation appears on the display as
the CalClock and in the calibration record.
16.09.2005 08:53:54
Lab 860 02320025
Calibration pH
Cal time: 16.09.2005 08:22:14
Cal interval:7d
AutoCal TEC
Buffer 1 2.000
Buffer 2 4.010
Buffer 3 7.000
Buffer 4 10.011
b1 -177.0 mV 25.0 °C
b2 177.0 mV 25.0 °C
b3 0.0 mV 25.0 °C
Slope : -58.99 mV/pH
Asymmetry : 0.4 mV
Sensor : +++
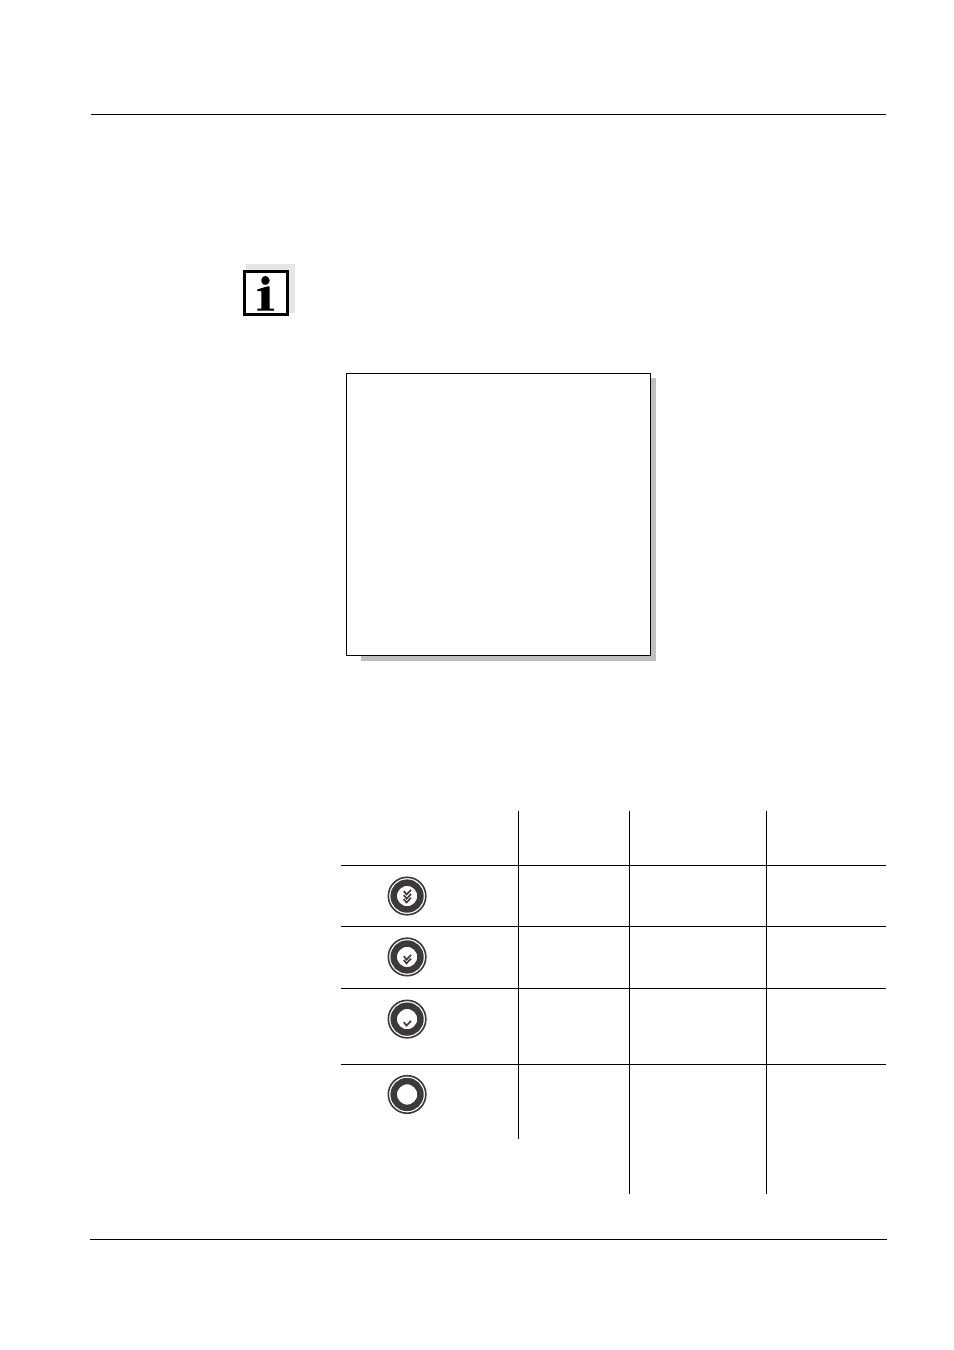
CalClock
Calibra-
tion record
Zero point
[mV]
Slope
[mV/pH]
+++
-15 ... +15
-60.5 ... -58
++
-20 ... +20
-58 ... -57
+
-25 ... +25
-61 ... -60.5
or
-57 ... -56
-
-30 ... +30
-62 ... -61
or
-56 ... -50
Clean the electrode according to the
sensor operating manual