Switching characteristics, Operating characteristics – Diodes 74AHC594 User Manual
Page 6
74AHC594
Document number: DS35484 Rev. 3 - 2
6 of 11
June 2013
© Diodes Incorporated
74AHC594
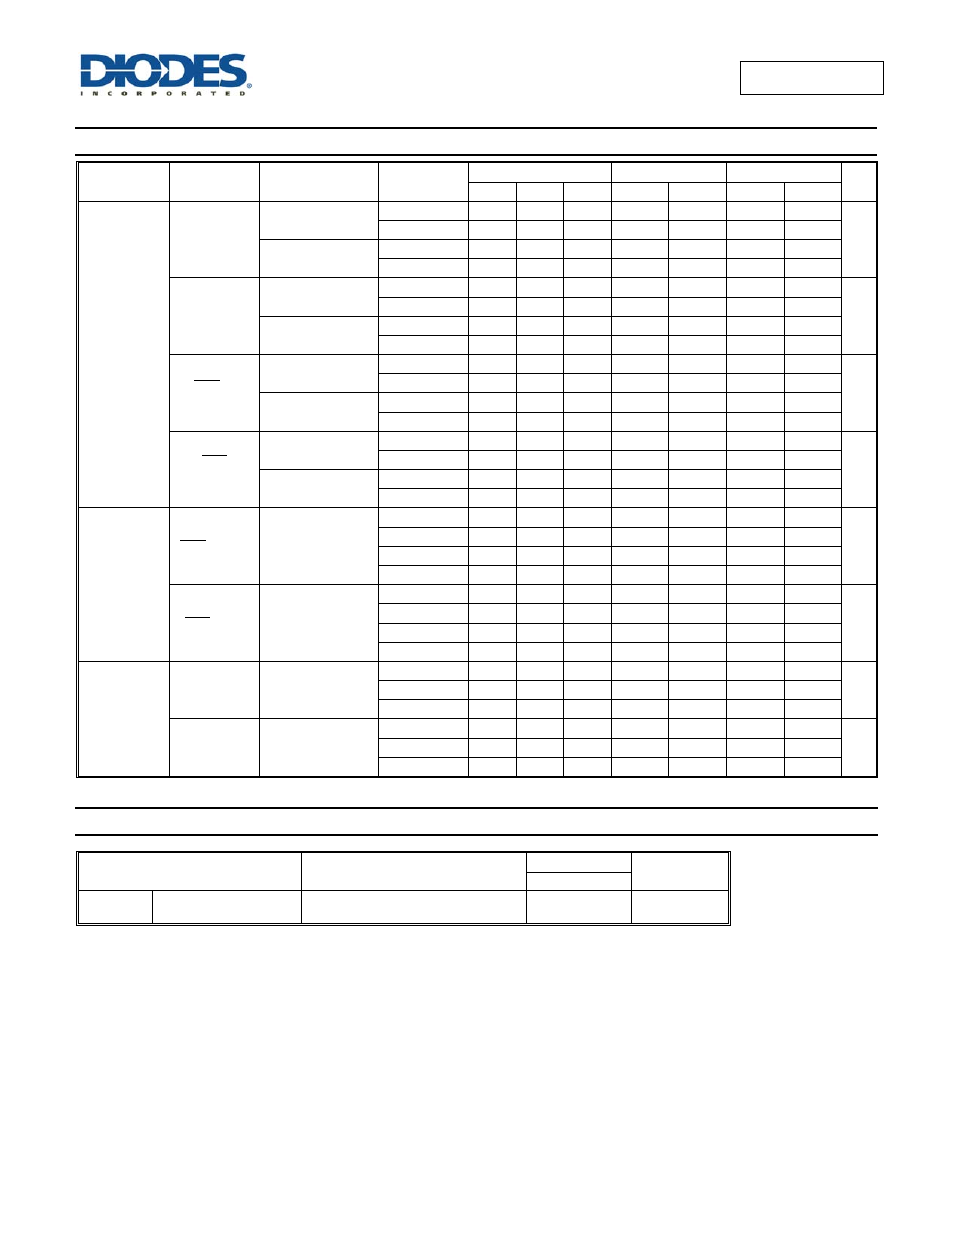
Switching Characteristics
(cont.)
Symbol /
Parameter
Pins
Test Conditions
V
CC
T
A
= +25°C
-40°C°C to +85°C -40°C°C to +125°C
Unit
Min
Typ
Max Min Max Min Max
t
PHLH
HIGH to LOW
Propagation
Delay
SHCP toQ7S
Figure 1 C
L
= 15pF
3.0V to 3.6V
5.5 8.9 2.3 10.2 2.3 11.0
ns
4.5V to 5.5V
4.1
6.7 1.9 7.6 1.9 8.2
Figure 1 C
L
= 50pF
3.0V to 3.6V
7.4
12.1 3.0 13.9 3.0 15.1
4.5V to 5.5V
5.4 8.8 2.5 10.1 2.5 11.0
STCP to Qn
Figure 1 C
L
= 15pF
3.0V to 3.6V
5.5 9.1 2.4 10.4 2.4 11.3
ns
4.5V to 5.5V
3.7
6.0 1.9 6.9 1.9 7.5
Figure 1 C
L
= 50pF
3.0V to 3.6V
7.3
12.0 3.2 13.8 3.2 15.0
4.5V to 5.5V
5.2
8.5 2.6 9.7 2.6 10.5
SHR to
Q7S
Figure 1 C
L
= 15pF
3.0V to 3.6V
5.7 9.5 2.3 10.8 2.3 11.7
ns
4.5V to 5.5V
4.1
6.7 2.0 7.6 2.0 8.2
Figure 1 C
L
= 50pF
3.0V to 3.6V
7.5
12.2 3.6 14.0 3.6 15.2
4.5V to 5.5V
5.4 8.8 2.8 10.1 2.8 11.0
STR
to Qn
Figure 1 C
L
= 15pF
3.0V to 3.6V
4.1
7.2 2.2 8.2 2.2 8.9
ns
4.5V to 5.5V
4.1
7.2 2.2 8.2 2.2 8.9
Figure 1 C
L
= 50pF
3.0V to 3.6V
5.4 9.4 3.0 10.7 3.0 11.6
4.5V to 5.5V
5.4 9.4 3.0 10.7 3.0 11.6
t
PHL
Propagation
Delay
SHR to Q7S
Figure 1
2.0V
39 150
185
225
ns
4.5V
14 30
37
45
5.0V
11
6.0V
12 26
31
38
STR to Qn
Figure 1
2.0V
39 125
155
185
ns
4.5V
14 25
31
37
5.0V
11
6.0V
12 21
26
31
t
THL
Transition
Time
Serial data
output Q7S
Figure 1
2.0V
19 75
95
110
ns
4.5V
7 15
19
22
6.0V
6 13
16
19
Parallel Data
Outputs Q
N
Figure 1
2.0V
14 60
75
90
ns
4.5V
5 12
15
18
6.0V
4 10
13
15
Operating Characteristics
(@T
A
= +25°C, unless otherwise specified.)
Parameter
Test
Conditions
V
CC
= 5V
Unit
Typ
C
pd
Power dissipation
capacitance
f = 1 MHz all outputs switching-no load
51 pF