Eq display, Band curves, Eq response – Universal Audio UAD Plug-Ins ver.7.4.2 User Manual
Page 376: Curve control points, Eq display” on, Eq display (see
UAD Powered Plug-Ins Manual
- 376 -
Chapter 38: Precision Multiband
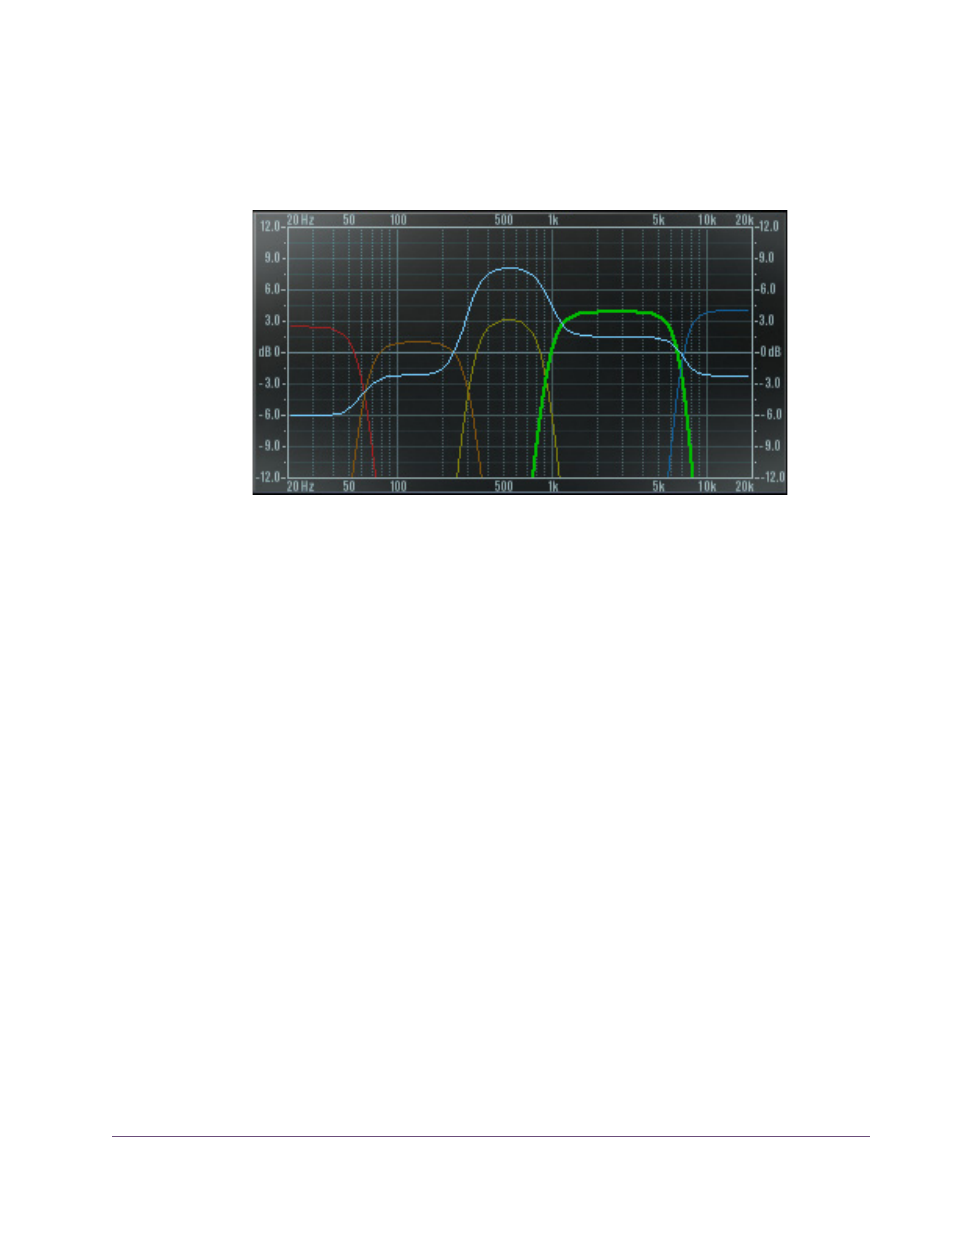
EQ Display
In the EQ Display, the entire audio spectrum from 20 Hz to 20 kHz is dis-
played along the horizontal axis. Gain and attenuation of the five band fre-
quencies (up to ±12 dB) are displayed along the vertical axis.
Band Curves
The Band Curves show the relative frequency and gain settings of the bands.
The sides of the colored curves are a representation of each band’s frequency
settings, and the top of each curve represents the band’s gain setting.
Note:
The currently selected band is displayed with a thicker bold line. Dis-
“Band Enable & Solo” on page 375
thinner line.
EQ Response
The EQ Display also shows the processed EQ response dynamically as a light
blue line across all bands (if the Dynamic EQ display option is enabled; see
“EQ Display Switch” on page 381
Curve Control
Points
Band gain, center frequencies (cF), crossover frequencies (xF), and band-
width can be modified by manipulating the colored band curves in the EQ
Display with the cursor.
When the cursor is moved over the pre-defined “hot spots” in the EQ Display,
the cursor changes shape to indicate that adjustments can be made. Each of
these control points and their corresponding available adjustments are de-
tailed below.
Figure 113. Precision Multiband EQ Display