Ocean Optics OOIBase16 User Manual
Page 10
8
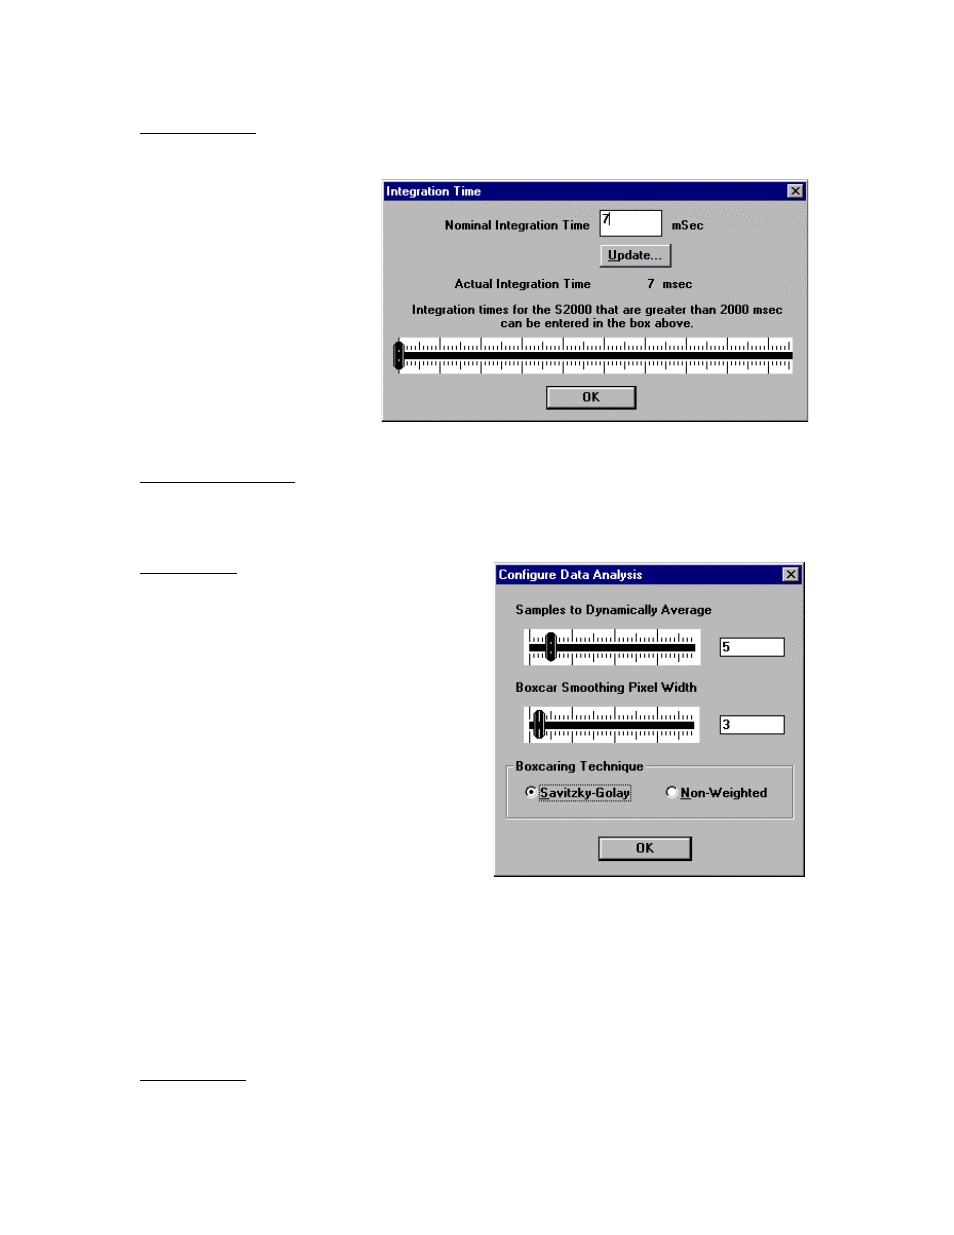
Integration Time
This command opens the “Integration Time” dialog box (see picture at right). The integration time of the
spectrometer is analogous to the shutter speed of a camera. The higher the integration time, the longer the
detector “looks” at the incoming
photons. If your Scope Mode
intensity is too low, increase this
value. If the intensity is too high,
decrease the value. You should
adjust the integration time so that
the greatest amount of light that
you anticipate for your application
causes a signal of about 3500
counts. While watching the graph
trace, adjust the integration time
until the signal intensity level is
approximately 3500 counts. The
integration time specified controls
all channels in your system.
Spectrometer Channel
This command opens the “Spectrometer Channel to View” dialog box. It allows you to animate the window
for a specific spectrometer channel.
Data Analysis
This command opens the “Configure Data Analysis”
dialog box (see picture at right). The functions in
this dialog box regulate S:N. The values specified
control only the activated window.
Samples to Dynamically Average is a signal
averaging function that averages x number of
spectra after it gets to OOIBase. The software
collects each spectrum and presents the running
average of the value entered in this box. The
maximum value is 30 scans. The S:N will improve
by the square root of the number of scans averaged.
(Another function averages spectra before the scans
get to OOIBase. Read about this preferred averaging
method in
Data Acquisition on page 9.)
Boxcar Smoothing Pixel Width is a technique
that averages across spectral data. This technique
averages a group of adjacent detector elements. A
value of 5, for example, averages each data point with 5 points to its left and 5 points to its right. The
greater this value, the smoother the data and the higher the S:N. The maximum value allowed is 50 pixels.
However, if the value entered is too high, a loss in spectral resolution will result. The S:N will improve by
the square root of the number of pixels averaged.
Choose Savitzky-Golay if you want the Boxcaring Technique to be weighted; otherwise, choose the
Non-Weighted option.
Set Graph Title
This command opens the “Graph Title” dialog box allowing you to specify the title for the current graph.
This title is displayed on the screen and is also printed when you select File | Print.