Ocean Optics SIR Series User Manual
Page 10
07-December-2010
Configure Range Scan (Scan properties):
Start: (This is the Starting Wavelength entered in nm) and based on the
calibration.
End: (Ending Wavelength) This is the ending wavelength of the scan
Samples: This is determined based on the resolution of the system. If the
system has a resolution of .1nm, and the sample bandwidth is 100nm, then 1000
samples should be taken. The software will calculate how often to take the
samples.
Filter Properties: If a filter/shutter wheel is installed, this selects the appropriate
wavelength for it to switch over
Detector Properties: If a hybrid detector is present, this will program the
appropriate wavelength for the system to switch over.
Other User interface features:
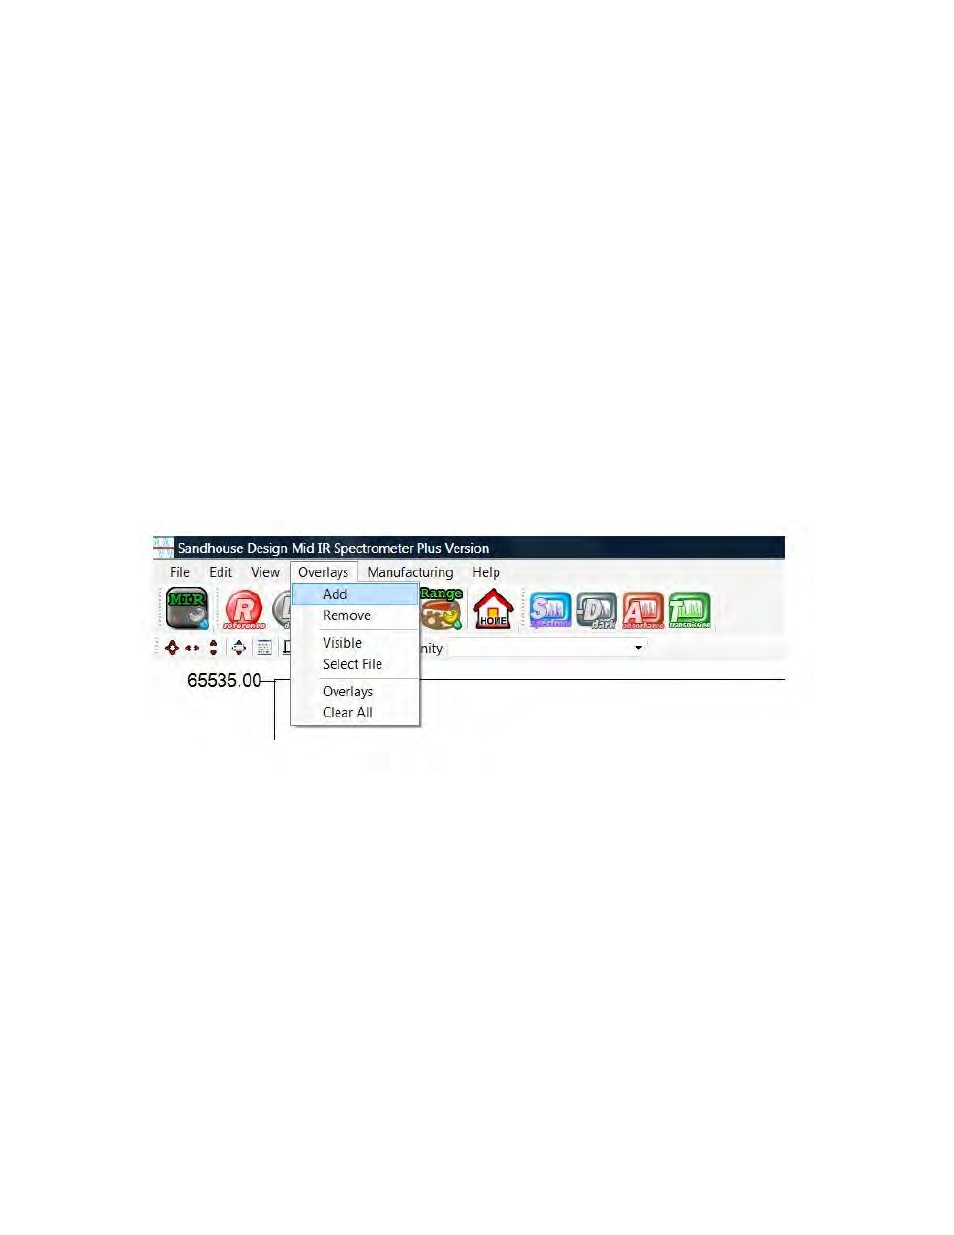
1. Overlays: The software has the ability to overlay saved data from previous
scans into the current graph view. This feature is accessed from the Overlays
Menu
2. Graph Zoom: It is possible to zoom in on features of the graph by right
clicking on the mouse button and dragging a box around the desired area
3. Graph Pan: Panning is achieved by clicking the left mouse button and
dragging the graph in the desired direction.
4. Extent Zoom: Double Clicking the mouse button will zoom the graph out to
the far extents of the data.
5. General Graph Zoom: Scrolling the mouse wheel will zoom in and out of the
center of the currently viewed graph window.
6. Cursor: By clicking on the graph, a cursor will appear and show the
corresponding wavelength location and analog value.