3B Scientific Air Cushion Plate User Manual
Page 26
27
Physical Experiments on the Air-Cushion Table
and finally, considerably less often, the 4:0 and
0:4 distributions. The frequencies of the 3:1 and
1:3 distributions are approximately equal, as are
the 4:0 and 0:4 distributions.
Interpretation:
The distribution of the molecules in a gas is gov-
erned by the laws of statistics. In the case of 4
molecules distributed onto 2 half spaces, the 0:4,
1:3, 2:2, 3:1 and 4:0 distributions occur at a ra-
tio of 1 : 4 : 6 : 4 : 1. This corresponds to the
relative frequencies of 6.25 % : 25 % : 37.5 % :
25% : 6.25%.
Note:
An easier method to determine the individual
distributions is to calculate and record the
distribution after a specified period of time (e.g.
5 seconds). It is sufficient to observe only one
half of the experiment surface and to determine
how many hover discs it contains at the specified
points in time.
The number of hover discs contained in the other
half is obtained by deduction from 4.
The ratio of distributions given above is
applicable under the assumption that the
molecules have a very low volume and that the
repulsive forces are effective only in the imme-
diate proximity of the molecules. These
conditions are not given in the case of the hover
discs used for demonstration. This is why the 2:2
distribution is overrepresented in the experiment,
while the other distributions occur less often than
expected.
2.1.18 Local Distribution of the Molecules in
a Gas
Components:
Air-cushion table with fan
Overhead projector
Magnetic barrier, long
2 Pieces
Magnetic barrier, short
2 Pieces
Manipulating rod
1 Piece
Hover disc, red
4 Pieces
Stop watch or master clock
Model simulation
Real Object
Model
Vessel containing
Experiment surface
the gas
of the air-cushion
Walls of the vessel
Magnetic barriers
Halves of the vessel Halves of the
experiment surface
Gas molecules
Hover discs
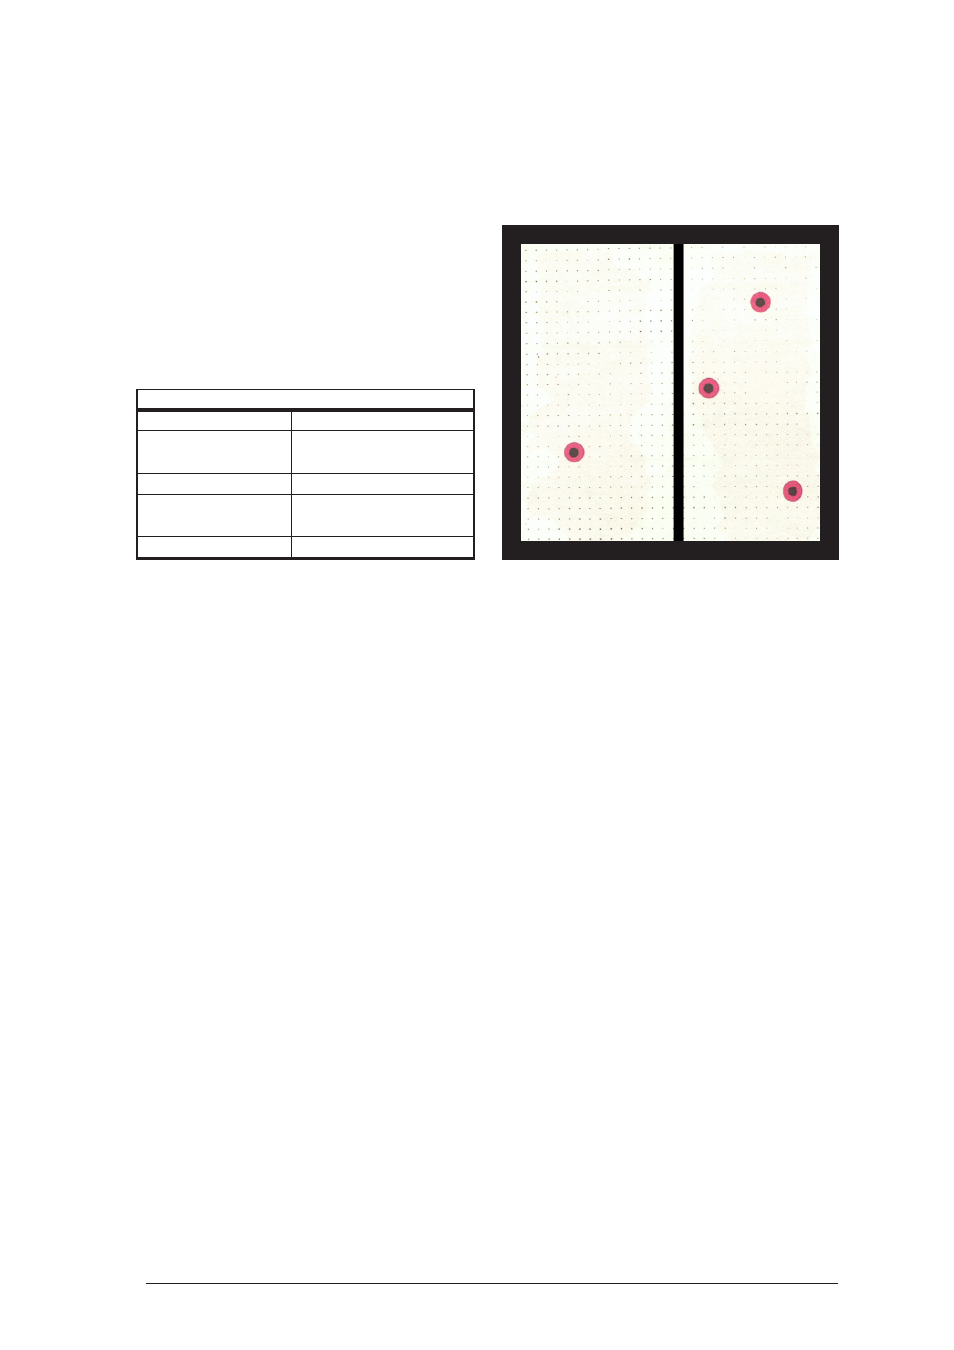
How to proceed:
After aligning the air-cushion table horizontally,
attach the magnetic barriers at the edges of the
experiment surface. The experiment surface is
divided in half by placing the manipulating rod
onto the middle of barriers nos. 3 and 4. Spread
the discs anywhere across the experiment surface
and turn the fan to a medium setting.
Increase the motion of the hover discs to a high
mean velocity by repeatedly opening the impulse
valve for a short time. When a specified period
of time has elapsed, examine the distribution of
the 4 hover discs in both spaces. This is done by
covering the connector opening of the fan with
the hand. Record the calculated distribution in
table 1. Then release the opening again and open
the impulse valve several times. Cover the
opening again after the specified period of time,
record the distribution, etc.
Depict the relative frequency of each possible
distribution in a bar chart after 20 experiments,
40 experiments, etc. (Fig. 5)
Result:
Although the hover discs move in a completely
disorderly fashion, the result obtained from a
large number of experiments is that the
distribution across both halves is subject to certain
rules. The distribution occurring most frequently
is 2:2, followed by the 3:1 and 1:3 distributions