3B Scientific Air Cushion Plate User Manual
Page 25
Physical Experiments on the Air-Cushion Table
26
Result:
The red discs hit the blue one at irregular
intervals, setting it into motion. Its speed and
direction of velocity change permanently,
resulting in a zigzag path.
Its average speed over time is much lower than
that of the red discs.
Interpretation:
Small particles (dust, smoke particles, water
droplets), which are visible under the microscope,
perform a Brownian motion in gases. It is caused
by the disordered motion of the gas molecules.
2.1.17 Density Distribution in a Gas in the
Gravitational Field
Components:
Air-cushion table with fan
Overhead projector
Magnetic barrier, long
2 Pieces
Magnetic barrier, short
2 Pieces
Hover disc, red
20 Pieces
Model simulation
Real Object
Model
Part of the earth’s
Experiment surface
atmosphere
of the air-cushion table
Gas molecules in the Hover discs
earth’s atmosphere
Gravitational field
Inclination of the
experiment surface
How to proceed:
Align the air-cushion table horizontally and attach
the magnetic barriers on the experiment surface.
Arrange the hover discs near the magnetic
barriers.
Turn the fan to a medium setting. Use the
adjusting screw on barrier no. 4 to tilt the
experiment surface of the apparatus more and
more towards the projecting wall. Observe the
changing distribution of the hover discs on the
experiment surface.
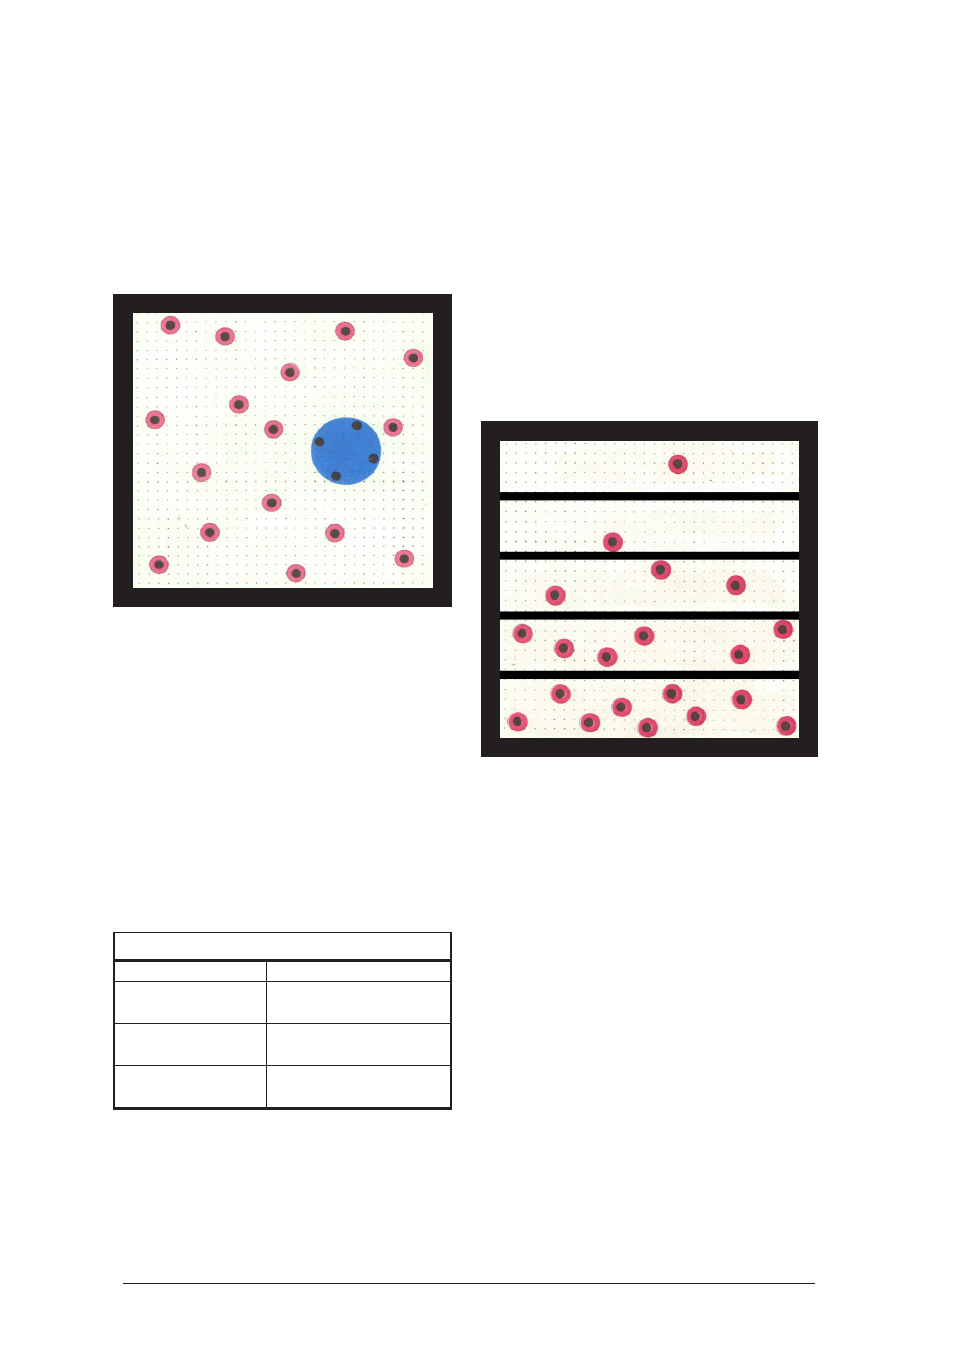
Result:
At first, the hover discs are evenly distributed
across the entire experiment surface. As the in-
clination increases, the density of the hover discs
decreases from the bottom to the top.
Interpretation:
Where gases are contained in the gravitational
field of the earth, the density of the gas decreas-
es with increasing distance to the earth’s surface.
Note:
The experiment can also be evaluated
quantitatively. Divide the experiment surface e.g.
in 5 parallel horizontal strips of equal width. This
can be done by drawing lines on a transparency
inserted under the air-cushion table. Turn off the
fan and count the number of discs contained in
each strip. When the average numbers of discs
contained in each strip calculated in several
measurements are depicted graphically as a
function of height, the slope of the graph will be
nearly exponential.
The deviations occur because each hover disc
takes up a relatively large area and the repulsive
forces have a noticeable influence on the motion
even from a distance of several centimeters.