2 input setup – Soft dB OBSI Software User Guide User Manual
Page 16
12
4.1.5
Display Area, Legend, display Settings and Rescale Axis
The display area can be one of the following displays:
•
Time history graph,
•
1/3 octave band graph,
•
FFT graph,
•
Numeric indicators.
The graph type and the data to be displayed are selected in the display setup interface. This
interface can be launched using the Display Settings button.
The legend on the top of each display area identifies the plot and displays the global level.
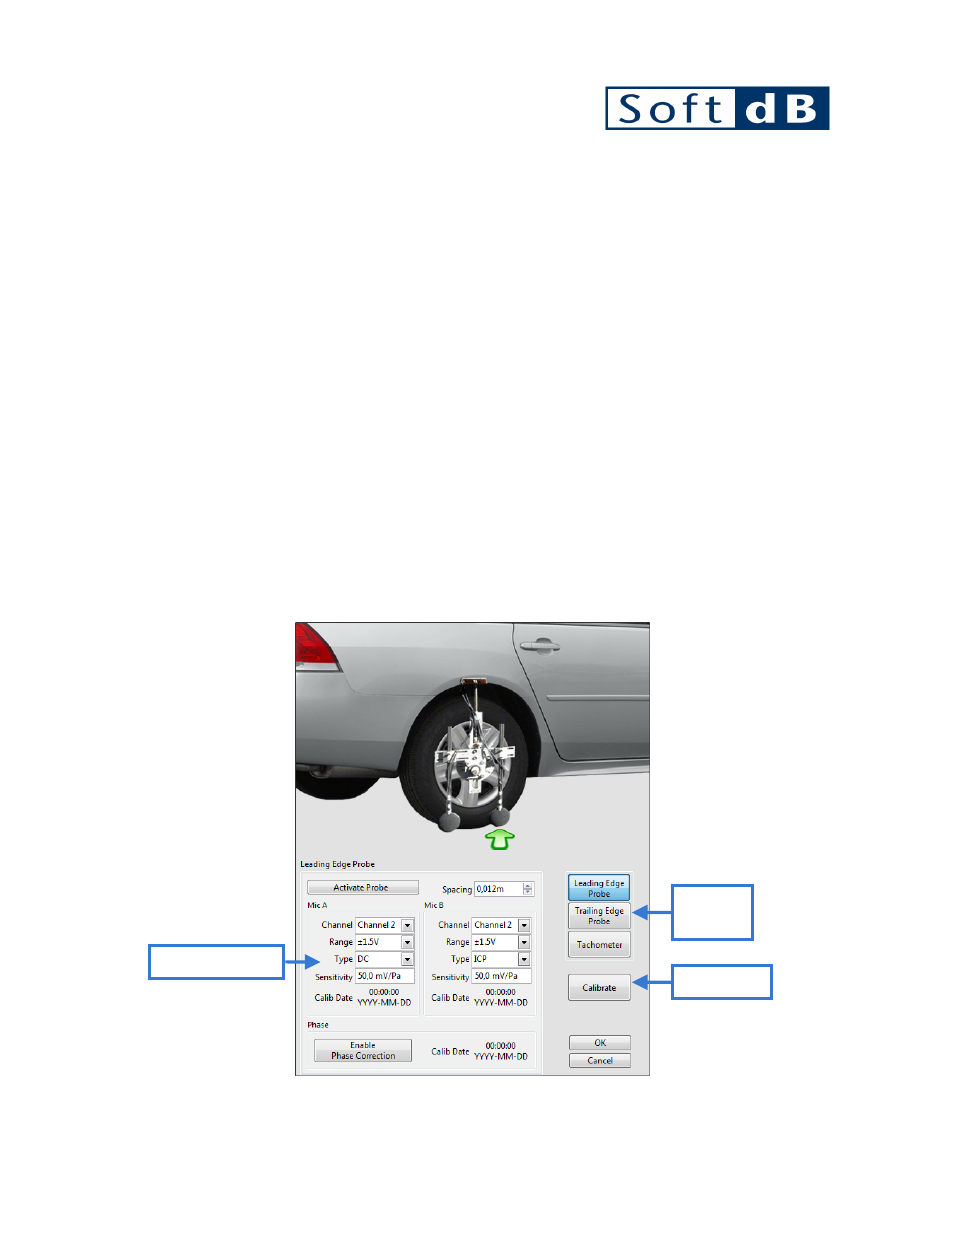
4.2 Input Setup
The Input setup is used prior to perform a measurement and is used to calibrate the sensors. To
launch this interface, go to Setup/Input Setup.
Input Setup Interface
Sensor
Selection
Sensor Setup
Calibration