1 trend chart, Figure 13 link info: trend chart – ZyXEL Communications G-302 User Manual
Page 32
ZyXEL G-302 v3 User’s Guide
32
Chapter 3 ZyXEL Utility Configuration
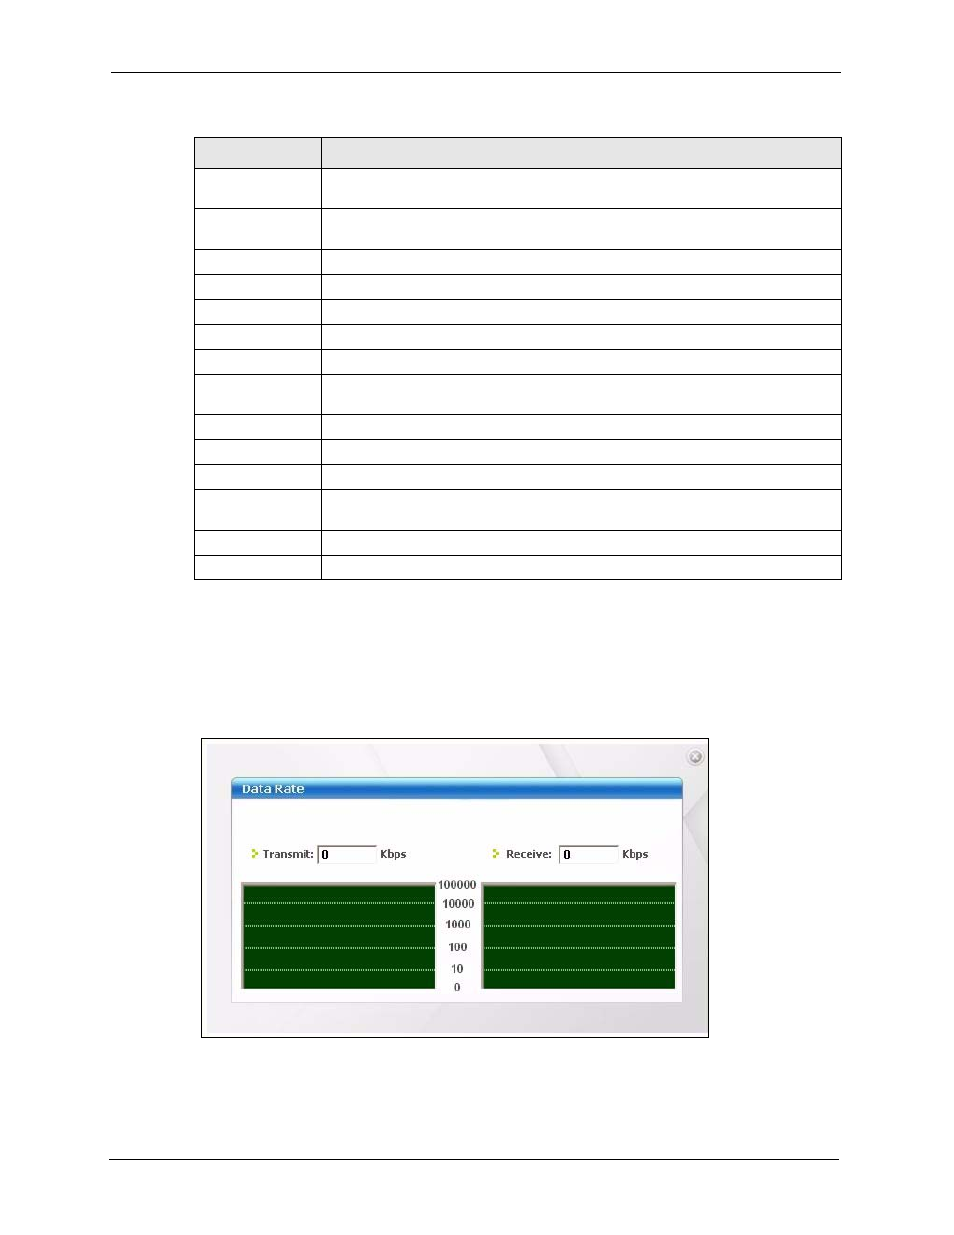
3.1.1 Trend Chart
Click Trend Chart in the Link Info screen to display a screen as shown below. Use this
screen to view real-time data traffic statistics.
Figure 13 Link Info: Trend Chart
Transmission Rate This field displays the current transmission rate of the G-302 v3 in megabits per
second (Mbps).
Security
This field displays whether data encryption is activated (WEP, WPA, WPA2, WPA-
PSK or WPA2-PSK) or inactive (DISABLE).
Channel
This field displays the radio channel the G-302 v3 is currently using.
Statistics
Transmit Rate
This field displays the current data transmission rate in kilobits per second (Kbps).
Receive Rate
This field displays the current data receiving rate in kilobits per second (Kbps).
Authentication
This field displays the authentication method of the G-302 v3.
Network Mode
This field displays the network standard (802.11b or 802.11g)
of the wireless
device.
Total Transmit
This field displays the total number of data frames transmitted.
Total Receive
This field displays the total number of data frames received.
Link Quality
This field displays the quality of the signal of the G-302 v3.
Trend Chart
Click this button to display the real-time statistics of the data rate in kilobits per
second (Kbps).
Signal Strength
The status bar shows the strength of the signal.
Link Quality
The status bar shows the quality of the signal.
Table 3 Link Info (continued)
LABEL
DESCRIPTION