Texas Memory Systems RamSan-325/325c User Manual
Page 60

RamSan-325/325c User’s Manual
- 56 -
5.2.2 Viewing Bandwidth Summary
Via Web Interface
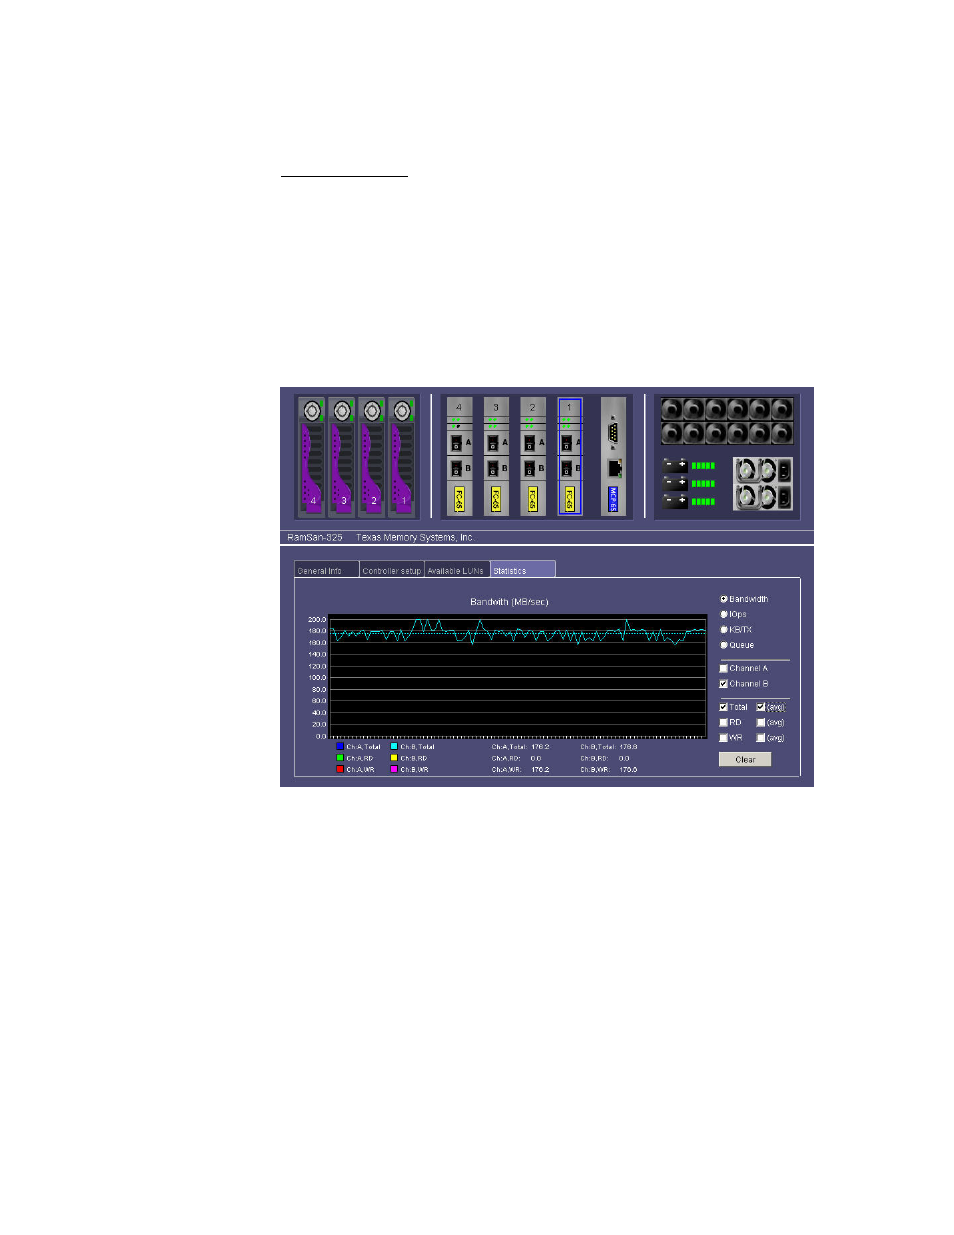
To view the bandwidth statistics via the web interface:
• Click on one of the “Fibre Channel” graphics or the
“Management Control Processor” graphic
• Click on the “Statistics” tab
• Click the radio button next to “Bandwidth”
The graphing tool provides the option to view read, write, and total
bandwidth, as well as a running average of each of these statistics.
To decode the colors on the graphical display, see the legend below
the check boxes.
Figure 5-15: Bandwidth Performance Graph via Web Interface
