Wiseries, 5 chart, Figure 4.13 chart – Omega WI8XX-U User Manual
Page 40: Chart
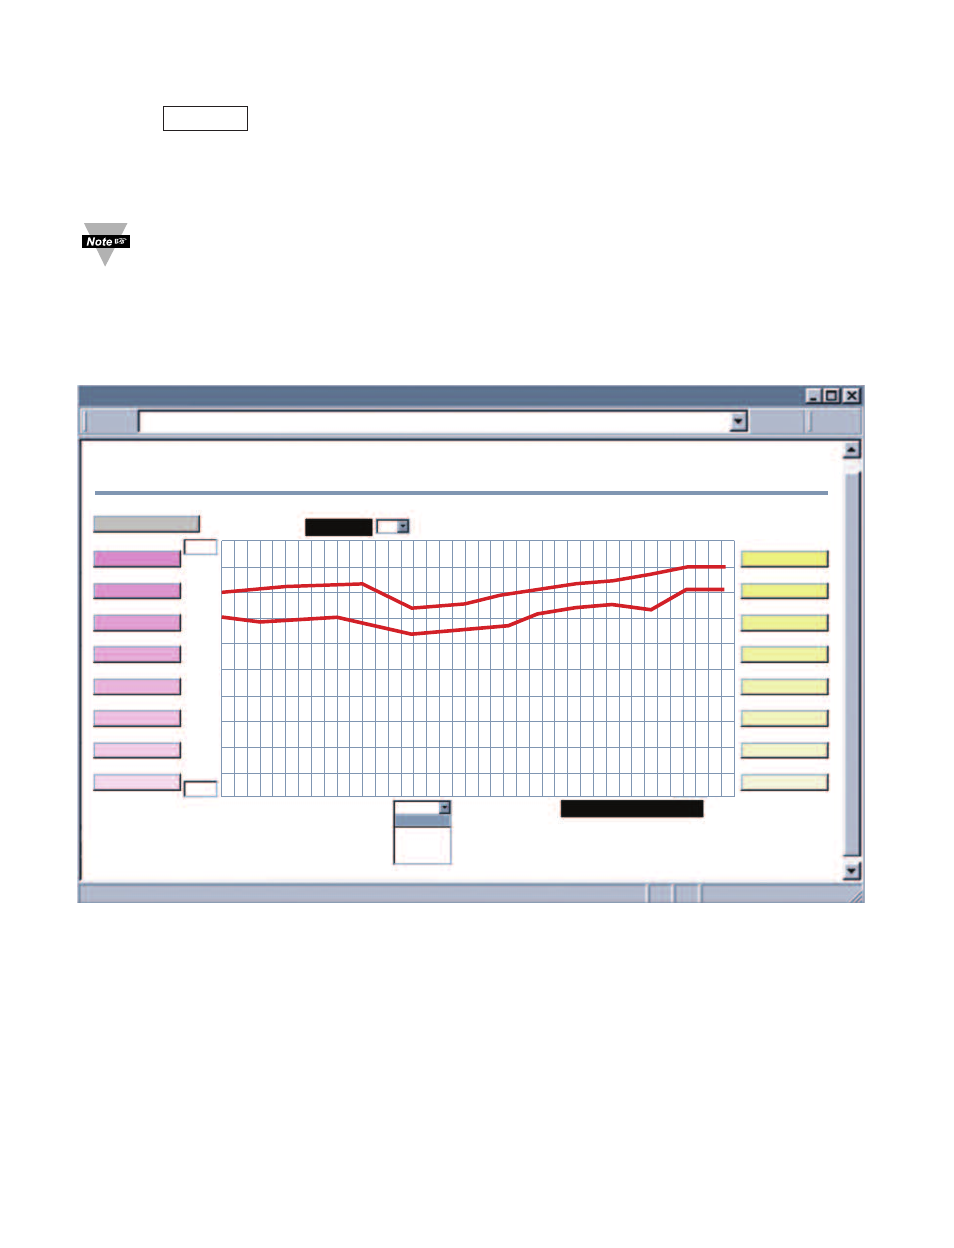
4.3.5 Chart
Click on
from the Home Page, the following page will appear.
The Java™ Applet graph displays Process Temperature and Ambient
Temperature. It can be charted across the full span or within any narrow range
(such as 20 to 30ºC).
If a blank screen appears without any "java application running" or image
of a "Java logo", please verify you have the latest Java Runtime
Environment installed and configured according to the instructions (refer
to Section 4.3.3.1). If you do not have Java Runtime Environment, you
may download it from our website or contact the Customer Service
Department nearest you.
Figure 4.13 Chart
wiSeries
Main Menu
CHART
(2 Seconds/Div)
1 Minute
1 Minute
1 Day
1 Week
1 Month
1 Year
0
5
C/Div
50
1200
300
100%
0%
10
%/Div
90
hPa/Div
C
hPa
Tue Feb 5 10:19:10 PDT 2008
Tue Feb 5 10:18:10 PDT 2008
http://192.168.1.200
Min/Max Temperature
48.0/41.0
P1 Process
P2 Sensor 2
P3 Process
P4 Process
P5 Process
P6 Process
P7 Process
P8 Sensor 8
A1 Ambient
A2 Sensor 2
A3 Ambient
A4 Ambient
A5 Ambient
A6 Ambient
A7 Ambient
A8 Sensor 8
Save Current Graph
Chart
34