Figure 6-5. signal spectra in the dac, Figure 6-5, Signal spectra in the dac -11 – National Instruments PCI-4452 User Manual
Page 69
Chapter 6
Theory of Analog Operation
©
National Instruments Corporation
6-11
PCI-4451/4452 User Manual
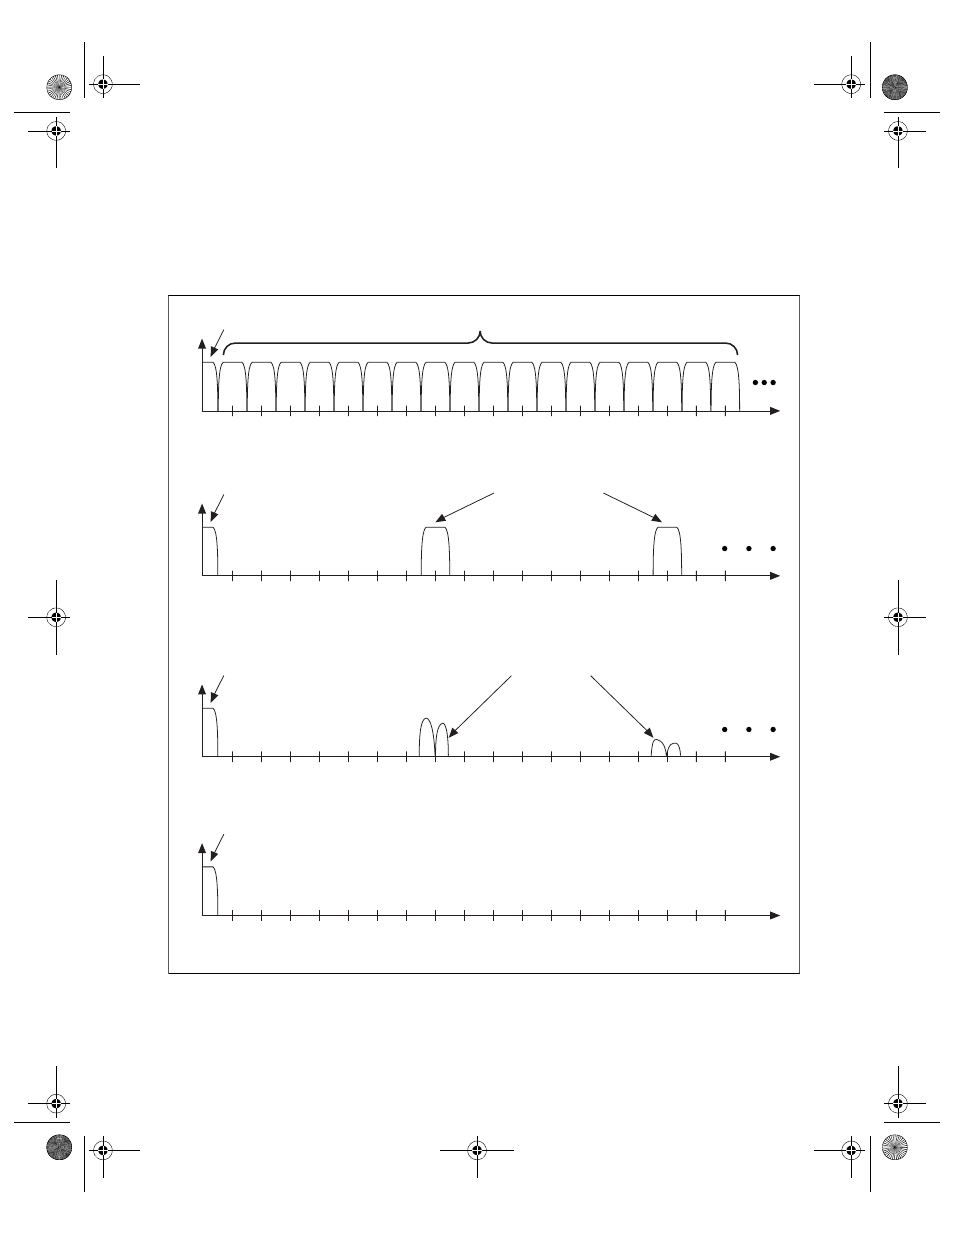
of eight times the sample rate, as shown in Figure 6-5c. Still, images remain
and they must be filtered out. Each output channel of the PCI-4451 has
discrete-time (switched-capacitor) and continuous-time analog filters that
remove the high-frequency images, as shown in Figure 6-5d.
Figure 6-5. Signal Spectra in the DAC
F
s
8 F
s
16 F
s
Baseband Signal
Images
a. Spectrum of Sampled Signal
b. Spectrum of Signal After Digital Filter
Frequency
Amplitude
F
s
8 F
s
16 F
s
Baseband Signal
Images After the Digital Filter
Frequency
Amplitude
Amplitude
c. Spectrum of Signal After DAC
F
s
8 F
s
16 F
s
Baseband Signal
Images After the DAC
Frequency
Amplitude
d. Spectrum of Signal After Analog Filters
F
s
8 F
s
16 F
s
Baseband Signal
Frequency
User.book Page 11 Tuesday, April 14, 1998 10:20 AM