Statistics tab, Signal strength, Figure 41: statistics tab – SysKonnect Wireless LAN Cardbus Adapter SK-54C1 User Manual
Page 42: Signal strength section, E section “statistics tab” on
42
3 Marvell Configuration Utility
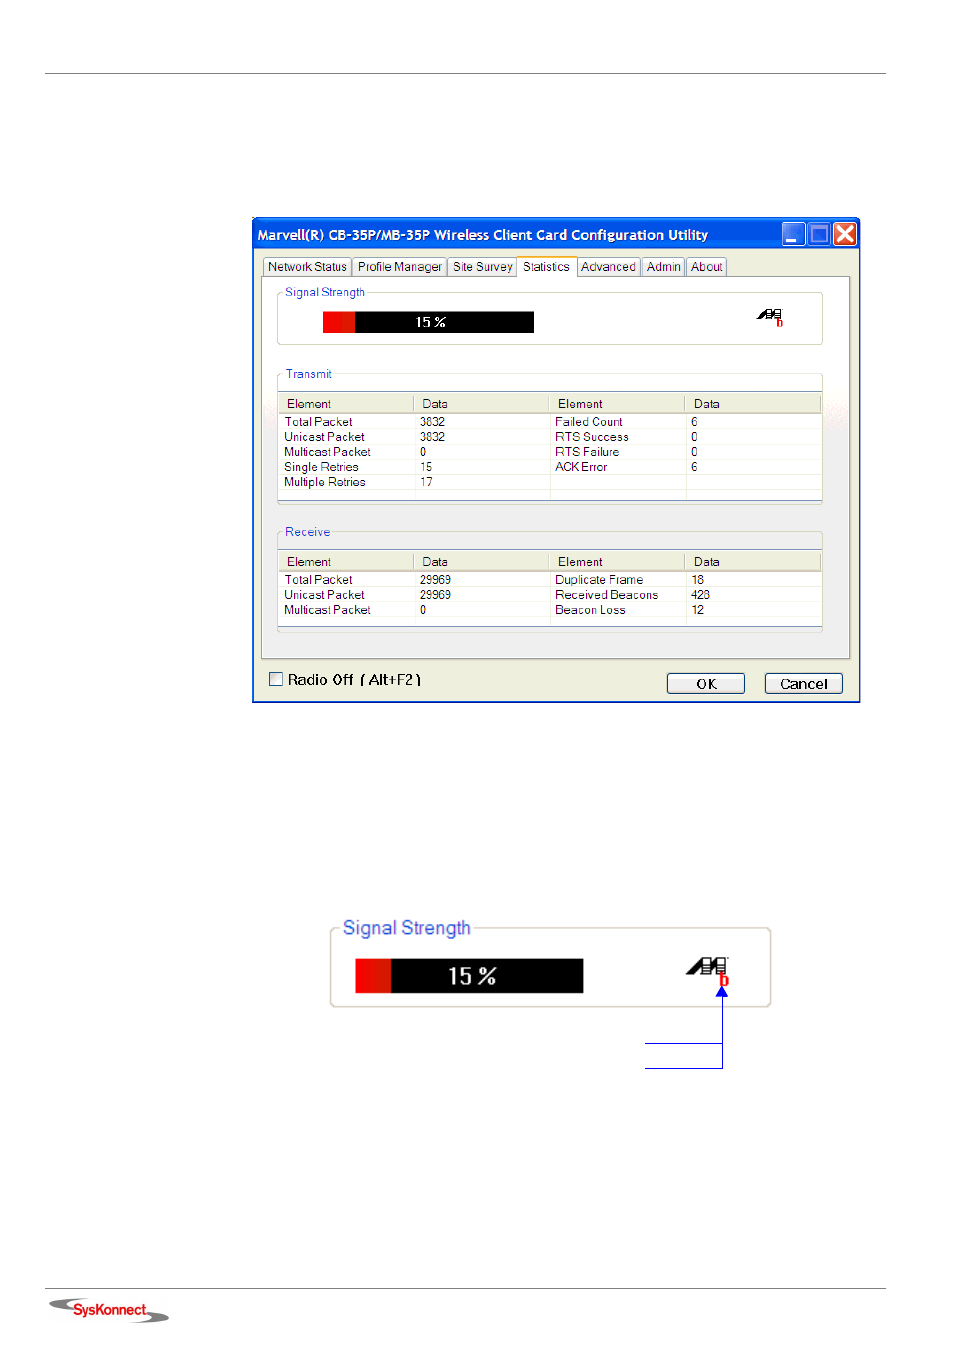
Statistics Tab
Clicking the S
TATISTICS
tab displays the statistics of the current connect session.
Figure 41. Statistics Tab
Signal Strength
The color-coded Signal Strength bar displays the signal strength of the last packet received
by the adapter. Signal strength is reported as a percentage. A signal in the red area indicates
a bad connection. A signal in the green area indicates a good connection.
Figure 42. Signal Strength Section
b means connected to an 802.11b capable AP.
g means connected to an 802.11g capable AP.