AltiGen MAXCS 7.5 MaxInSight User Manual
Page 26
22
MaxInSight Manual
1. Select one or more workgroups. To select a workgroup,
highlight the workgroup and click the Right-arrow button.
2. To specify the color of the bars, highlight a selected
workgroup, click Set Color and select a color. Repeat for
each workgroup selected.
3. To change the order of workgroups in a view, highlight a
selected workgroup and click the Up or Down button.
4. Select a field to chart from the Select Field drop-down list.
Only the fields of statistics data from the logger service you
specified at login will appear in the drop-down list. (The
logger service is shown in the Current Data Source field.)
5. In the Value Range fields, specify a value range for the
field you want to chart.
6. Specify the period for which you want to display statistics:
either the last x hours (select from 1-24), or a time period
you specify in the From and To fields (24-hour clock). Be
sure the time you select in the From field precedes the time
you select in the To field.
7. Select a time interval for display: 15 minutes, 30 minutes,
one hour.
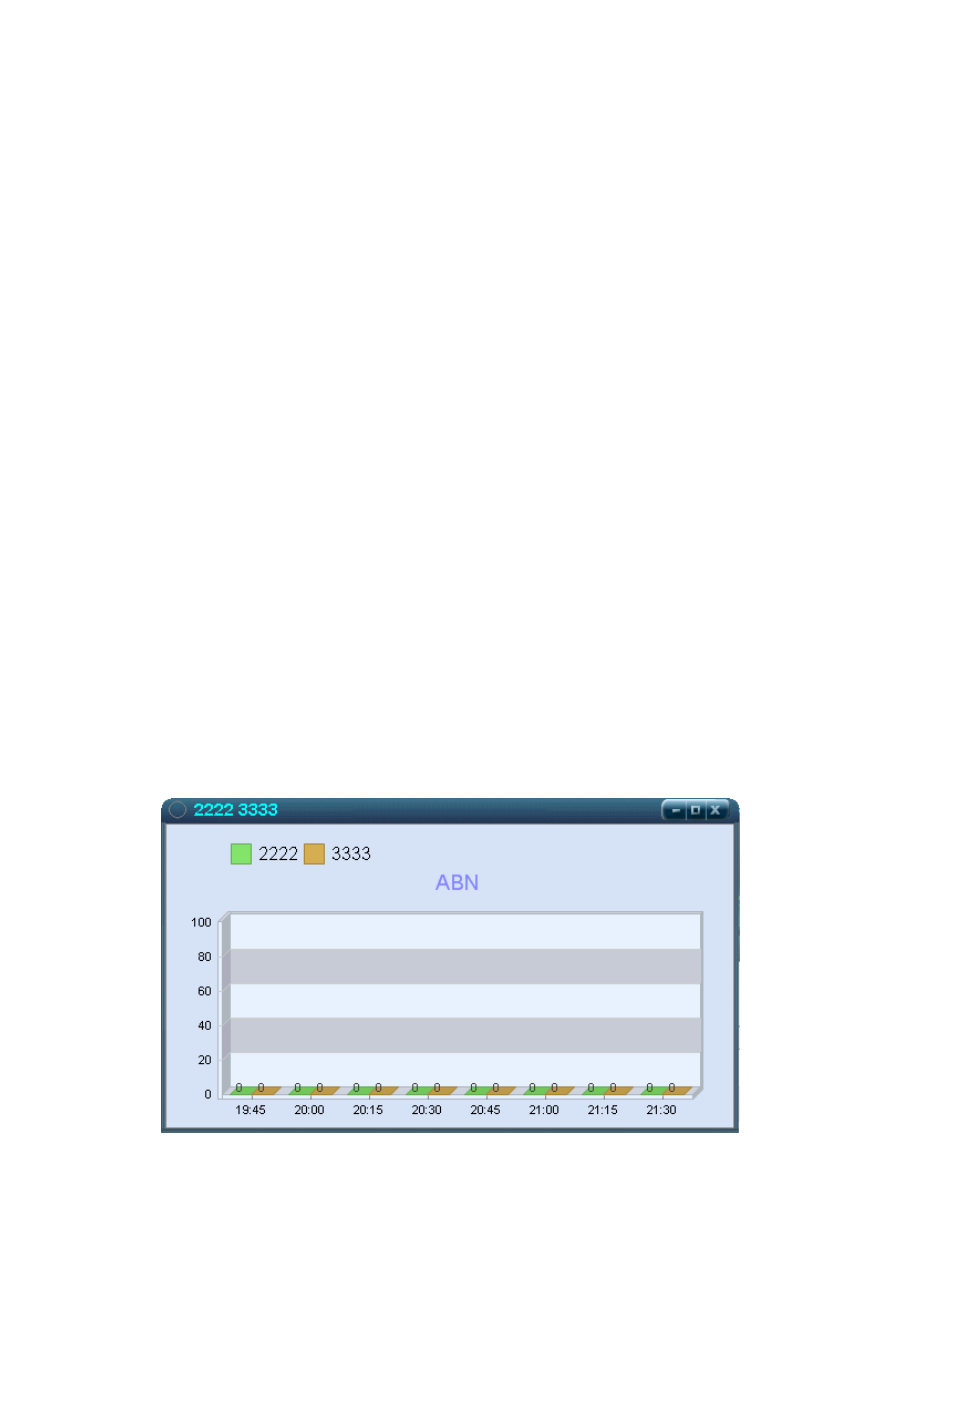
8. Click OK. A bar view is displayed. Workgroup number(s)
and their display colors are shown at the top.
Figure 5.
A vertical bar view showing history data for abandoned calls in two
workgroups. (No calls were abandoned.)