AltiGen MAXCS 7.5 AltiReport User Manual
Page 74
70
AltiReport
Manual
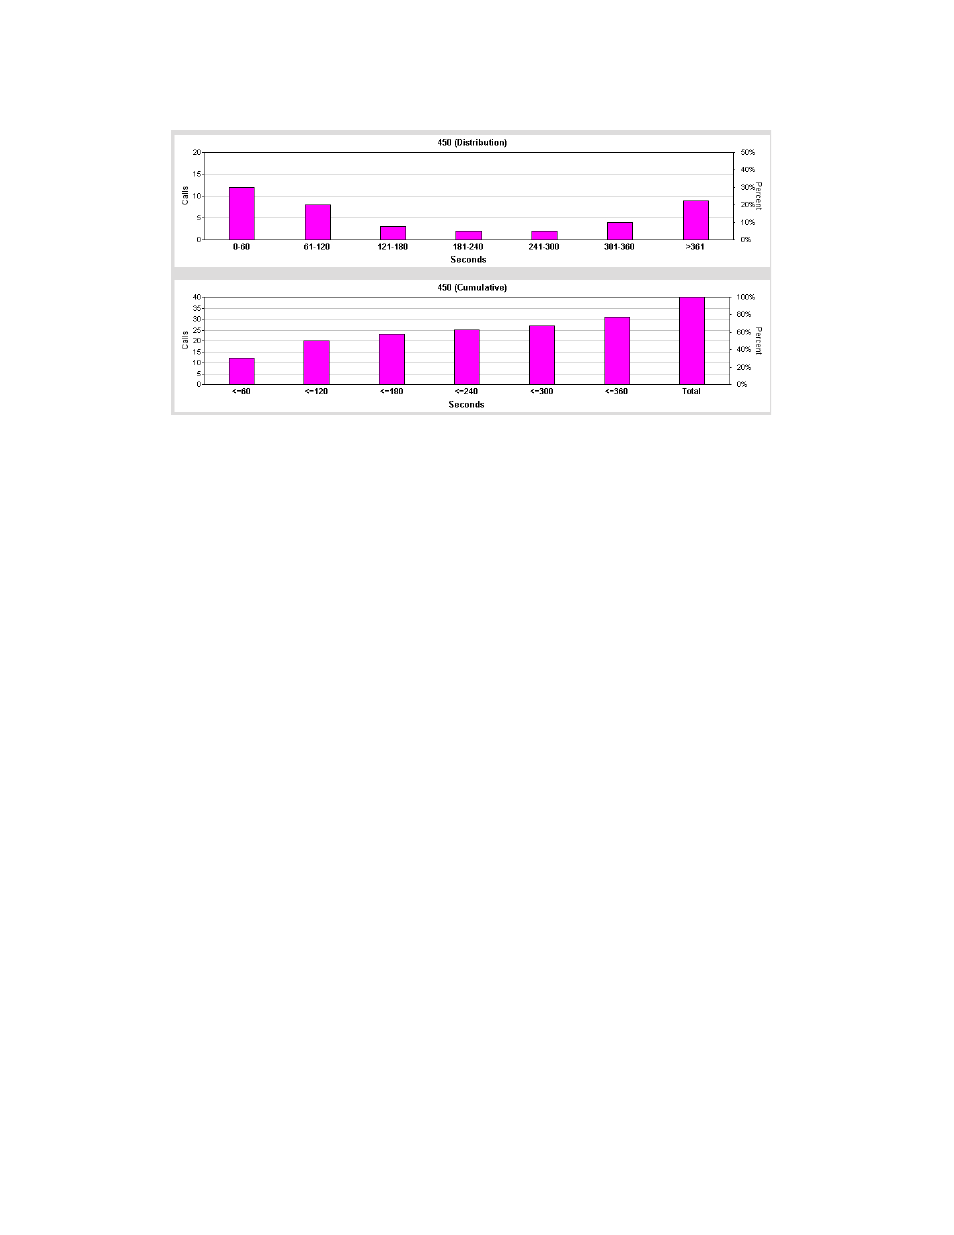
The data is also displayed in two graphs:
Figure 26. The top graph shows the number and percentage of calls abandoned within the
specified time periods (in increments of 60 seconds, in this case). The bottom
graph shows, cumulatively, how many calls were abandoned as the time periods
progress.
Data Source
All data from the table CDRMAIN
See also other documents in the category AltiGen Software:
- Voice Mail System (2 pages)
- MAXCS 7.5 ACM Administration (446 pages)
- MAXCS 7.5 Advanced Call Router (34 pages)
- MAXCS 7.5 AltiConsole (44 pages)
- MAXCS 7.5 CDR (95 pages)
- MAXCS 7.5 MaxAgent (95 pages)
- MAXCS 7.5 MaxCommunicator (89 pages)
- MAXCS 7.5 Salesforce Connector Configuration Guide (17 pages)
- MAXCS 7.5 New Features Guide (22 pages)
- MAXCS 7.5 Softswitch Deployment Guide (37 pages)
- MAXCS 7.5 Upgrade Guidelines (7 pages)
- MAXCS 7.5 MaxInSight (34 pages)
- MAXCS 7.5 MaxOutlook (79 pages)
- MAXCS 7.5 MaxSupervisor (42 pages)
- MAXCS 7.5 SightMax Configuration Guide (7 pages)
- MAXCS 7.5 Telephony Hardware (70 pages)
- MAXCS 7.5 VRManager (32 pages)
- MAXCS 7.5 Polycom Configuration Guide (24 pages)
- MAXCS 7.5 Polycom VVX User Guide (11 pages)
- MAXCS 7.5 Polycom SoundPoint User Guide (6 pages)
- MAXCS 7.5 MaxMobile User Guide, iPhone (32 pages)
- MAXCS 7.0 Update 1 Adv Call Router (34 pages)
- MAXCS 7.0 Update 1 AltiConsole (44 pages)
- MAXCS 7.0 Update 1 AltiReport (110 pages)
- MAXCS 7.0 Update 1 CDR (95 pages)
- MAXCS 7.0 Update 1 FXS Configuration with AudioCodes (25 pages)
- MAXCS 7.0 Update 1 MaxAgent (93 pages)
- MAXCS 7.0 Update 1 MaxCommunicator (87 pages)
- MAXCS 7.0 Update 1 Salesforce Connector Configuration Guide (17 pages)
- MAXCS 7.0 Update 1 New Features Guide (26 pages)
- MAXCS 7.0 Update 1 Softswitch Deployment Guide (14 pages)
- MAXCS 7.0 Update 1 Upgrade Guidelines (6 pages)
- MAXCS 7.0 Update 1 MultiVOIP Configuration (27 pages)
- MAXCS 7.0 Update 1 MaxInSight (34 pages)
- MAXCS 7.0 Update 1 MaxMobile User Guide for iPhone (32 pages)
- MAXCS 7.0 Update 1 MaxOutlook (79 pages)
- MAXCS 7.0 Update 1 MaxSupervisor (42 pages)
- MAXCS 7.0 Update 1 SightMax (7 pages)
- MAXCS 7.0 Update 1 Telephony Hardware (68 pages)
- MAXCS 7.0 Update 1 VRManager (32 pages)
- MAXCS 7.0 Adv Call Router (26 pages)
- MAXCS 7.0 AltiConsole (44 pages)
- MAXCS 7.0 AltiReport (110 pages)
- MAXCS 7.0 CDR (95 pages)