ADS Environmental Services Eureka Digital QR 775020 A0 User Manual
Page 43
ADS Eureka Digital System User Manual
39
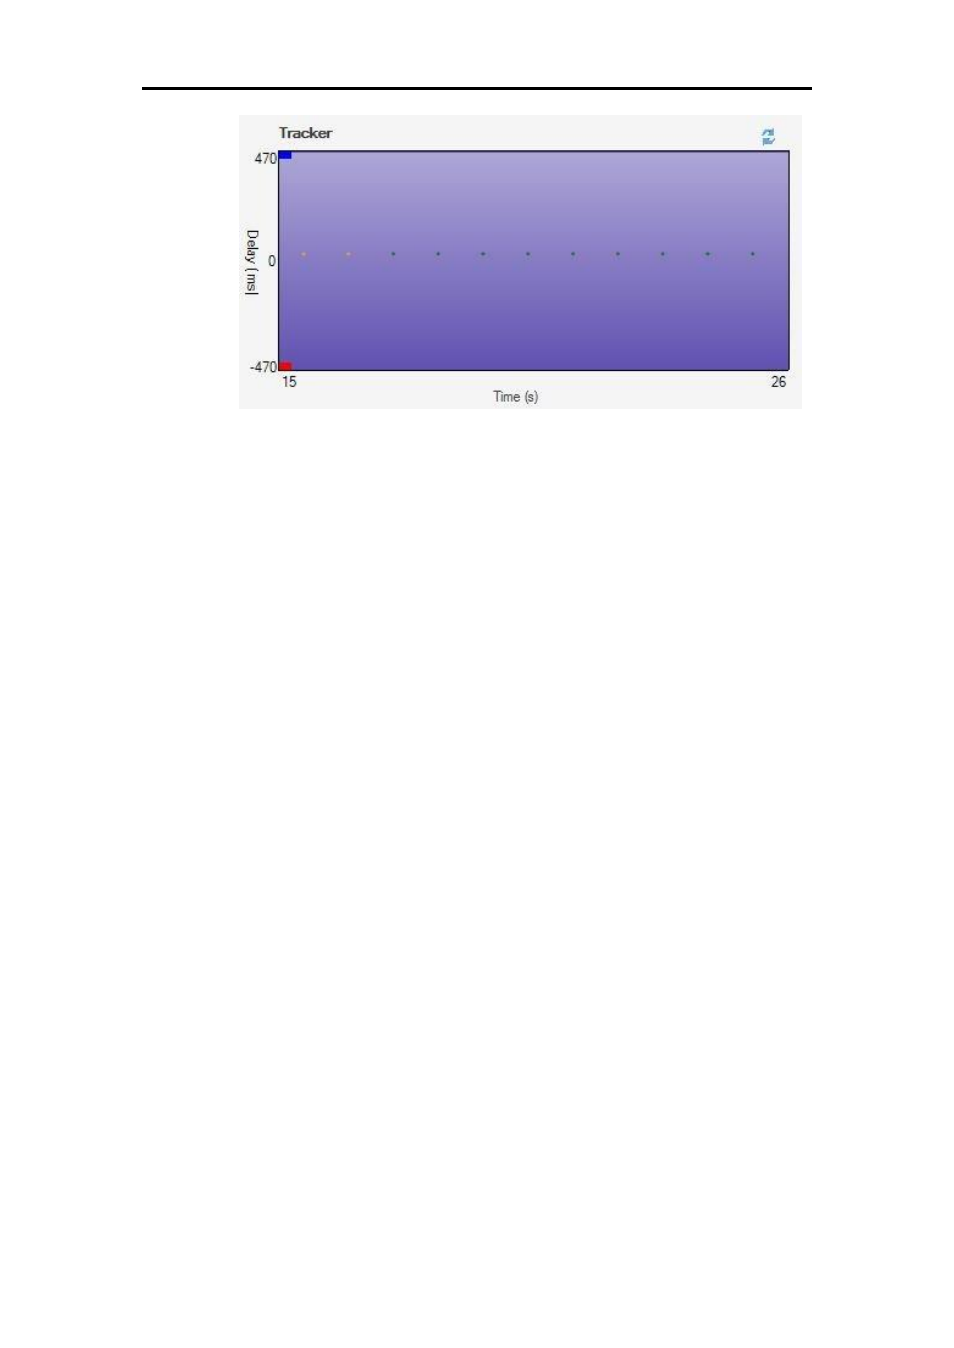
Zoomed in Tracker display
Select a specific area of the Tracker display with the mouse to perform a
software correlation analysis for only the selected area. This can be
beneficial in contexts such as high background noise or traffic areas for
choosing a time period in which a correlation peak begins to form (e.g.,
when traffic noise is reduced).
To return to an analysis of the whole area, click on the button above the
Tracker graph.