Pipe display, Spectrum display – ADS Environmental Services Eureka Digital QR 775020 A0 User Manual
Page 41
ADS Eureka Digital System User Manual
37
This shows when a connection exists between the PC and
the receiver.
Pipe Display
The pipe display shows the pipe and the transmitters in a schematic
format, including the appropriate lengths of pipe and the pipe material. Set
the pipe data using the pipe data tab.
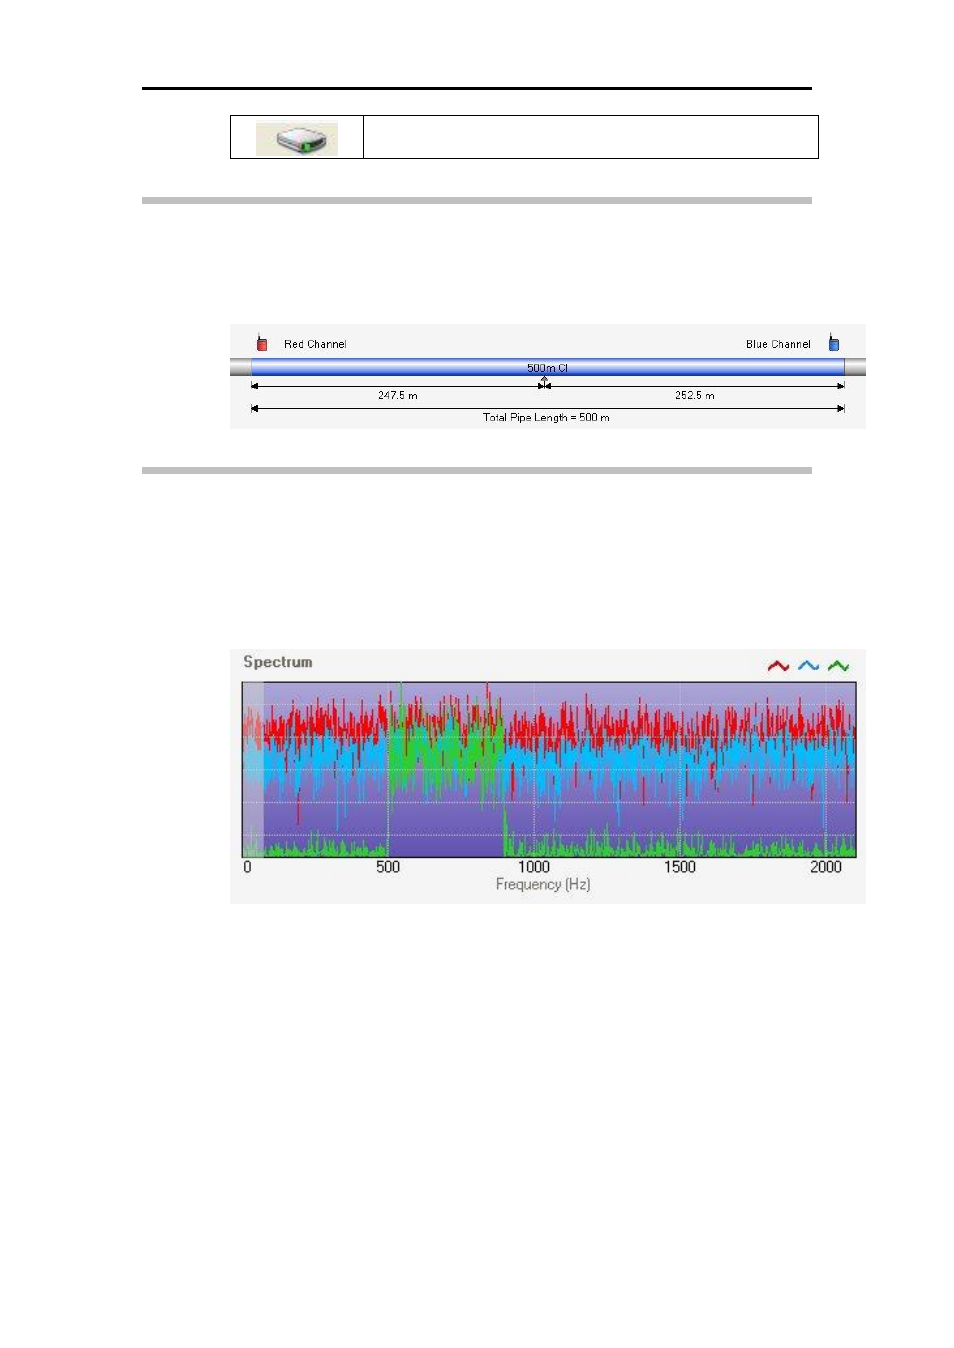
Spectrum Display
The spectrum display shows the amplitude and frequency of the data. The
display will show up to three traces. Display individual traces using the
colored trace buttons just above the spectrum display.
The traces can be from the red and blue transmitters or the (yellow)
receiver unit.
The colored buttons at the top of the screen individually show/hide the
trace of the corresponding color. This allows the user to see individual
traces or combinations as required.
Coherence
Clicking on the green trace button shows the green coherence trace. The
coherence shows the similarity between two recordings at each frequency.
When the coherence is higher, select the filters to use these frequencies.