Casio fx-9750G Implicit Function Graphs User Manual
Page 5

227
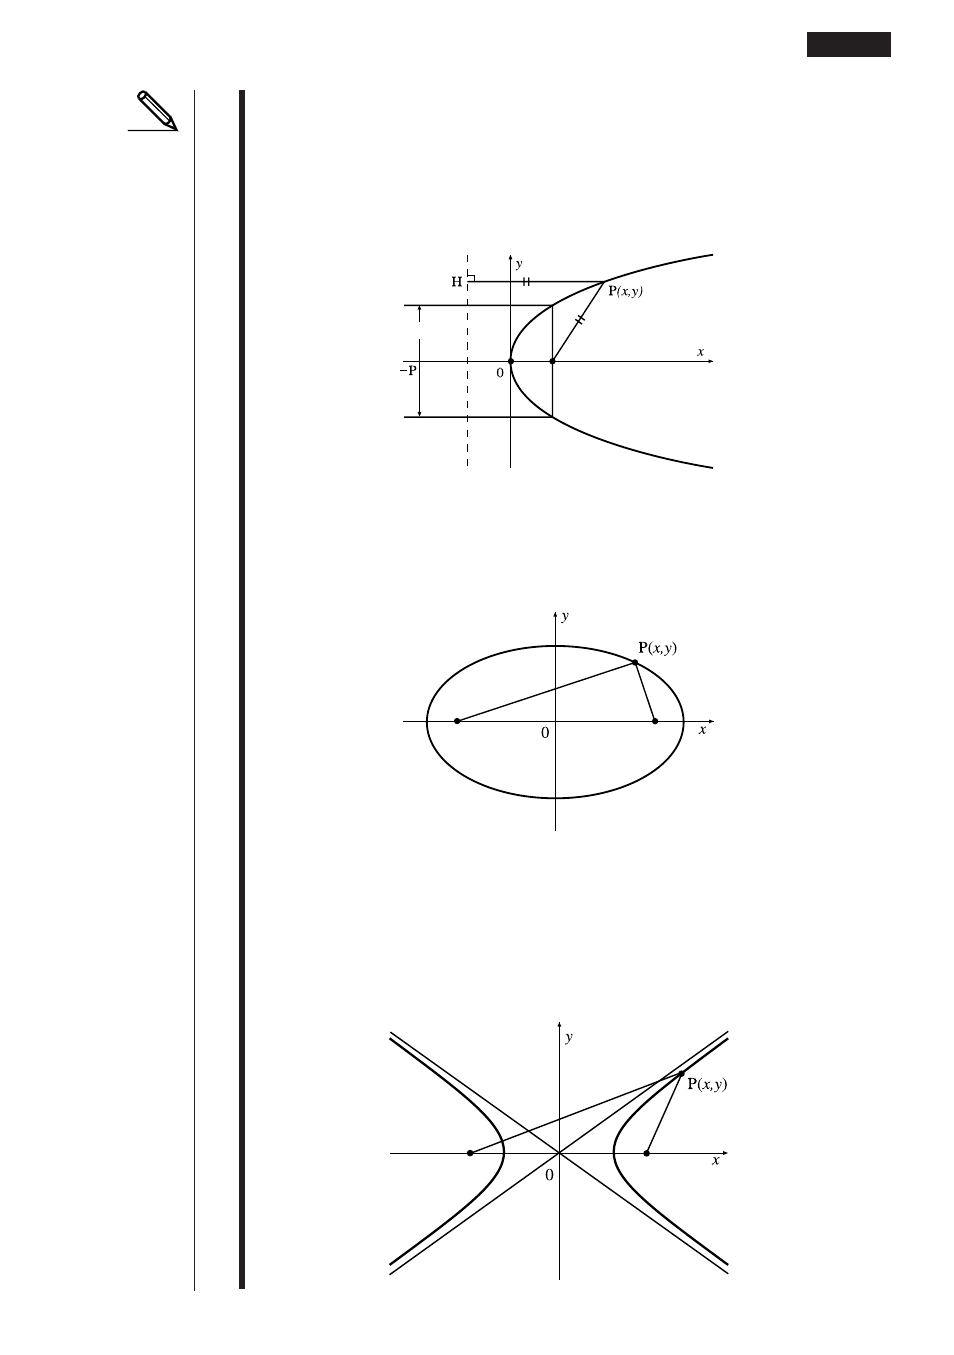
• A parabola is the locus of points equidistant from fixed line
l
and fixed point F
not on the line. Fixed point F is the “focus,” fixed line
l
is the “directrix,” the
horizontal line that passes through the focus directrix is the “axis of symmetry,”
the length of a straight line that intersects the parabola, passes through the
locus, and is parallel to fixed line
l
is the “latus rectum,” and point A where the
parabola intersects the axis of symmetry is the “vertex.”
• An ellipse is the locus of points the sum of the distances of each of which from
two fixed points F and F’ is constant. Points F and F’ are the “foci,” points A, A’,
B, and B’ where the ellipse intersects the
x
- and
y
-axes are the “vertexes,” the
x
-coordinate values of vertexes A and A’ are called
x
-intercepts, and the
y
-
coordinate values of vertexes B and B’ are called
y
-intercepts.
• A hyperbola is the locus of points related to two given points F and F’ such that
the difference in distances of each point from the two given points is constant.
Points F and F’ are the “foci,” points A and A’ where the hyperbola intersects
the
x
-axis are the “vertexes,” the
x
-coordinate values of vertexes A and A’ are
called
x
-intercepts, the
y
-coordinate values of vertexes A and A’ are called
y
-
intercepts, and straight lines
i
and
i
' , which get closer to the hyperbola as they
move away from the foci are “asymptotes.”
Axis of symmetry
Latus rectum
Directrix
l
Vertex A
Focus F (p, 0)
Graphing an Implicit Function
14 - 2
x
-intercept A’
Focus F’
Focus F
x
-intercept A
y
-intercept B’
y
-intercept B
Focus F'
Focus F
Vertex
A’
Vertex
A
Asymptote
l
Asymptote
l'
