Casio fx-9750G Implicit Function Graphs User Manual
Page 4
226
• Certain View Window parameters can make a circle graph come out looking like
an ellipse. When this happens, you can use the graph correction function (SQR)
to make corrections and produce a perfect circle.
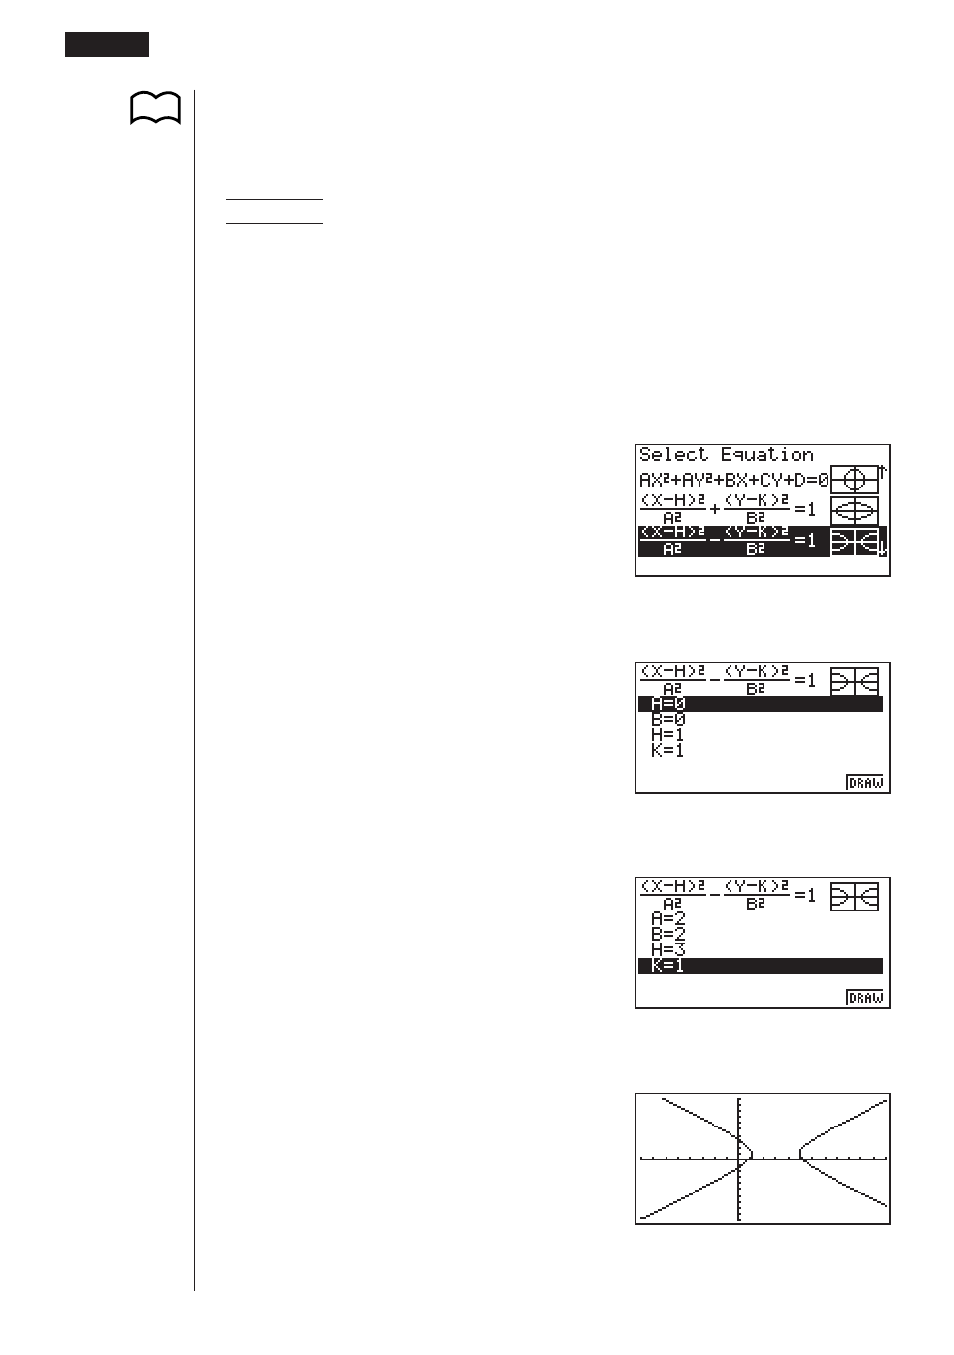
(X – 3)
2
(Y – 1)
2
Example 2
To graph the hyperbola –––––––––– – –––––––––– = 1
2
2
2
2
Use the following View Window parameters.
Xmin
= –8
Ymin
= –10
Xmax = 12
Ymax = 10
Xscale = 1
Yscale =
1
1. Select the function whose graph you want to draw.
ccccccc
2. Press
w
and the variable input screen appears.
w
3. Assign values to each variable.
cw
cw
dw
bw
4. Press
6
(DRAW) to draw the graph.
6
(DRAW)
1 2 3 4 5
6
P.155
14 - 2
Graphing an Implicit Function
See also other documents in the category Casio Calculators, organizers:
- fx-115ES (75 pages)
- fx-115ES (54 pages)
- FX-9750GII (402 pages)
- FX-9750GII (17 pages)
- FX-9750GII (411 pages)
- FX-300MS (2 pages)
- FX-300MS (9 pages)
- DJ-120TG (67 pages)
- FX-9860G AU E (9 pages)
- FX-9860G AU E (6 pages)
- FX-CG20 (18 pages)
- fx-FD10 Pro (601 pages)
- FX-CG20 (601 pages)
- MJ-120D (75 pages)
- fx-115MS (46 pages)
- fx-115MS (39 pages)
- FX-82SOLAR (38 pages)
- fx-9750G PLUS Getting Acquainted (39 pages)
- fx-9750G Dual Graph (8 pages)
- fx-7400G Programming (486 pages)
- fx-570ES PLUS (46 pages)
- fx-991ZA PLUS (59 pages)
- fx-350TL (36 pages)
- CFX-9950GB PLUS (28 pages)
- CFX-9850GB PLUS (19 pages)
- ALGEBRA FX 1.0 PLUS Programming (603 pages)
- ALGEBRA FX2.0 Advanced Statistics INTR (596 pages)
- ALGEBRA FX2.0 Advanced Statistics DIST (67 pages)
- TE-100 (88 pages)
- 9860 (5 pages)
- EMULATOR FX-ES (18 pages)
- fx-7400G Getting Acquainted (12 pages)
- FX-912MS (19 pages)
- s-v.p.a.m. fx-300MS (40 pages)
- fx-5800P (147 pages)
- SF-4900ER (118 pages)
- FX-991WA (38 pages)
- SF-7200SY (83 pages)
- ClassPad 300 PLUS (18 pages)
- ClassPad 330 V.3.03 (670 pages)
- ClassPad 300 Spreadsheet Application (954 pages)
- ClassPad 300 Spreadsheet Application (965 pages)
- ClassPad 300 Spreadsheet Application (753 pages)
- fx-570W (43 pages)
- fx-3950P (61 pages)