Casio fx-9750G Implicit Function Graphs User Manual
Page 10
232
2
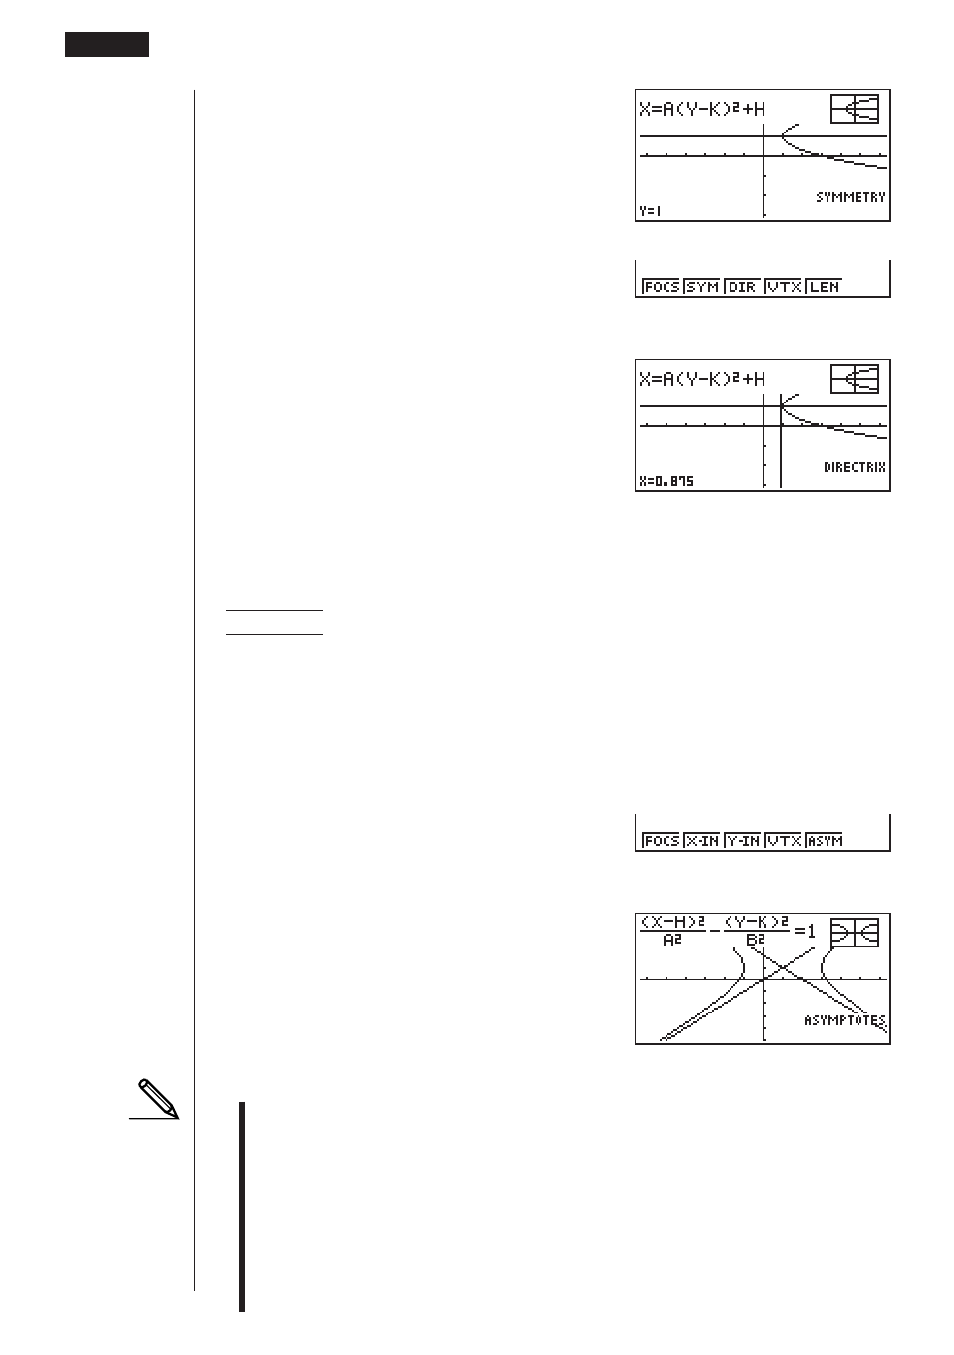
(SYM)
(Draws the axis of symmetry.)
5
(G-Solv)
3
(DIR)
(Draws the axis of directrix.)
uuuuu
To draw and analyze the asymptotes
Example
To draw the asymptotes for the hyperbola
(X – 1)
2
(Y – 1)
2
–––––––––– – –––––––––– = 1
2
2
2
2
Use the following View Window parameters.
Xmin
= –6.3
Ymin
= –5
Xmax = 6.3
Ymax = 5
Xscale = 1
Yscale = 1
5
(G-Solv)
5
(ASYM)
(Draws the asymptotes.)
• Certain View Window parameters can produce errors in graph analysis result
values.
• The message ”Not Found” appears on the display when graph analysis is
unable to produce a result.
• The following can result in inaccurate analysis results or may even make it
impossible to obtain a solution at all.
• When the solution is tangent to the
x
-axis.
• When the solution is a point of tangency between two graphs.
1 2
3
4 5 6
1 2 3 4
5
6
14 - 3
Implicit Function Graph Analysis
- fx-115ES (54 pages)
- fx-115ES (75 pages)
- FX-9750GII (402 pages)
- FX-9750GII (17 pages)
- FX-9750GII (411 pages)
- FX-300MS (2 pages)
- FX-300MS (9 pages)
- DJ-120TG (67 pages)
- FX-9860G AU E (9 pages)
- FX-9860G AU E (6 pages)
- FX-CG20 (601 pages)
- FX-CG20 (18 pages)
- fx-FD10 Pro (601 pages)
- MJ-120D (75 pages)
- fx-115MS (39 pages)
- fx-115MS (46 pages)
- FX-82SOLAR (38 pages)
- fx-9750G Dual Graph (8 pages)
- fx-7400G Programming (486 pages)
- fx-9750G PLUS Getting Acquainted (39 pages)
- fx-570ES PLUS (46 pages)
- fx-991ZA PLUS (59 pages)
- fx-350TL (36 pages)
- CFX-9850GB PLUS (19 pages)
- CFX-9950GB PLUS (28 pages)
- ALGEBRA FX 1.0 PLUS Programming (603 pages)
- ALGEBRA FX2.0 Advanced Statistics INTR (596 pages)
- ALGEBRA FX2.0 Advanced Statistics DIST (67 pages)
- TE-100 (88 pages)
- 9860 (5 pages)
- EMULATOR FX-ES (18 pages)
- fx-7400G Getting Acquainted (12 pages)
- FX-912MS (19 pages)
- s-v.p.a.m. fx-300MS (40 pages)
- fx-5800P (147 pages)
- SF-4900ER (118 pages)
- FX-991WA (38 pages)
- SF-7200SY (83 pages)
- ClassPad 330 V.3.03 (670 pages)
- ClassPad 300 Spreadsheet Application (954 pages)
- ClassPad 300 Spreadsheet Application (965 pages)
- ClassPad 300 Spreadsheet Application (753 pages)
- ClassPad 300 PLUS (18 pages)
- fx-570W (43 pages)
- fx-3950P (61 pages)