2 graphing an implicit function – Casio fx-9750G Implicit Function Graphs User Manual
Page 3
225
14-2
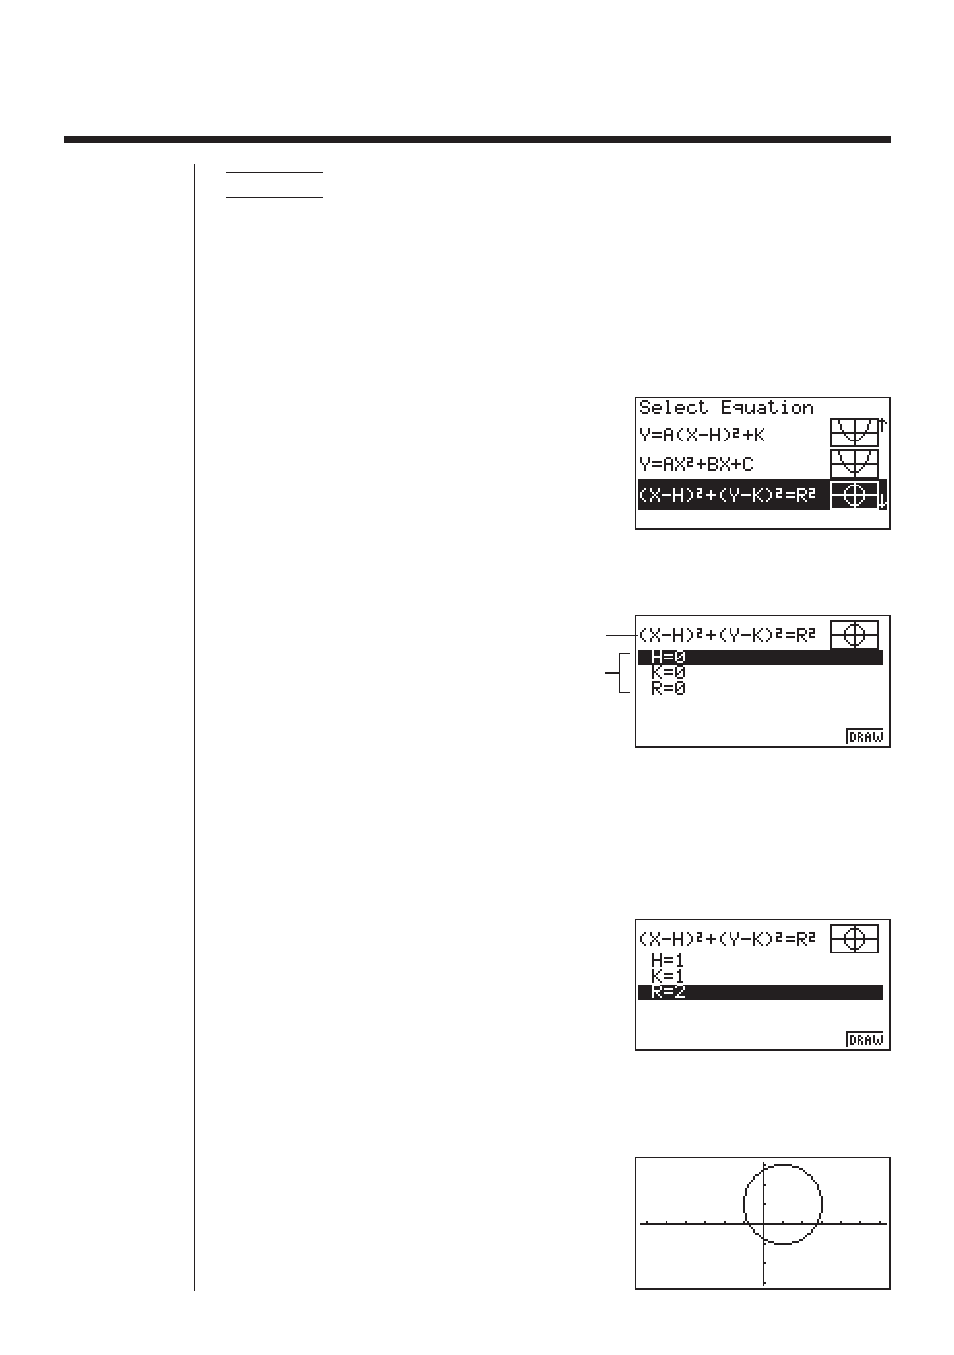
Graphing an Implicit Function
Example 1
To graph the circle (X – 1)
2
+ (Y – 1)
2
= 2
2
Use the following View Window parameters.
Xmin
= –6.3
Ymin
= –3.1
Xmax = 6.3
Ymax = 3.1
Xscale = 1
Yscale = 1
1. Select the function whose graph you want to draw.
cccc
2. Press
w
and the variable input screen appears.
w
Graph function
Function variables
• The values that appear are the values currently assigned to each variable, which
are general variables used by the calculator. If the values include an imaginary
part, only the real part appears on the display.
3. Assign values to each variable.
bw
bw
cw
• You can also use
f
and
c
to highlight a
variable and then input a value.
4. Press
6
(DRAW) to draw the graph.
6
(DRAW)
1 2 3 4 5
6
See also other documents in the category Casio Calculators, organizers:
- fx-115ES (75 pages)
- fx-115ES (54 pages)
- FX-9750GII (402 pages)
- FX-9750GII (17 pages)
- FX-9750GII (411 pages)
- FX-300MS (2 pages)
- FX-300MS (9 pages)
- DJ-120TG (67 pages)
- FX-9860G AU E (9 pages)
- FX-9860G AU E (6 pages)
- FX-CG20 (18 pages)
- fx-FD10 Pro (601 pages)
- FX-CG20 (601 pages)
- MJ-120D (75 pages)
- fx-115MS (46 pages)
- fx-115MS (39 pages)
- FX-82SOLAR (38 pages)
- fx-9750G PLUS Getting Acquainted (39 pages)
- fx-9750G Dual Graph (8 pages)
- fx-7400G Programming (486 pages)
- fx-570ES PLUS (46 pages)
- fx-991ZA PLUS (59 pages)
- fx-350TL (36 pages)
- CFX-9950GB PLUS (28 pages)
- CFX-9850GB PLUS (19 pages)
- ALGEBRA FX 1.0 PLUS Programming (603 pages)
- ALGEBRA FX2.0 Advanced Statistics INTR (596 pages)
- ALGEBRA FX2.0 Advanced Statistics DIST (67 pages)
- TE-100 (88 pages)
- 9860 (5 pages)
- EMULATOR FX-ES (18 pages)
- fx-7400G Getting Acquainted (12 pages)
- FX-912MS (19 pages)
- s-v.p.a.m. fx-300MS (40 pages)
- fx-5800P (147 pages)
- SF-4900ER (118 pages)
- FX-991WA (38 pages)
- SF-7200SY (83 pages)
- ClassPad 300 PLUS (18 pages)
- ClassPad 330 V.3.03 (670 pages)
- ClassPad 300 Spreadsheet Application (954 pages)
- ClassPad 300 Spreadsheet Application (965 pages)
- ClassPad 300 Spreadsheet Application (753 pages)
- fx-570W (43 pages)
- fx-3950P (61 pages)