Tvm graph – Casio ALGEBRA FX2.0 Financial User Manual
Page 27
27
11. TVM Graph
The TVM Graph lets you assign two of the five parameters (
n
,
I
%,
PV
,
PMT
,
FV
) to the
x
-axis
and
y
-axis of a graph, and plot changes in
y
as the value of
x
changes.
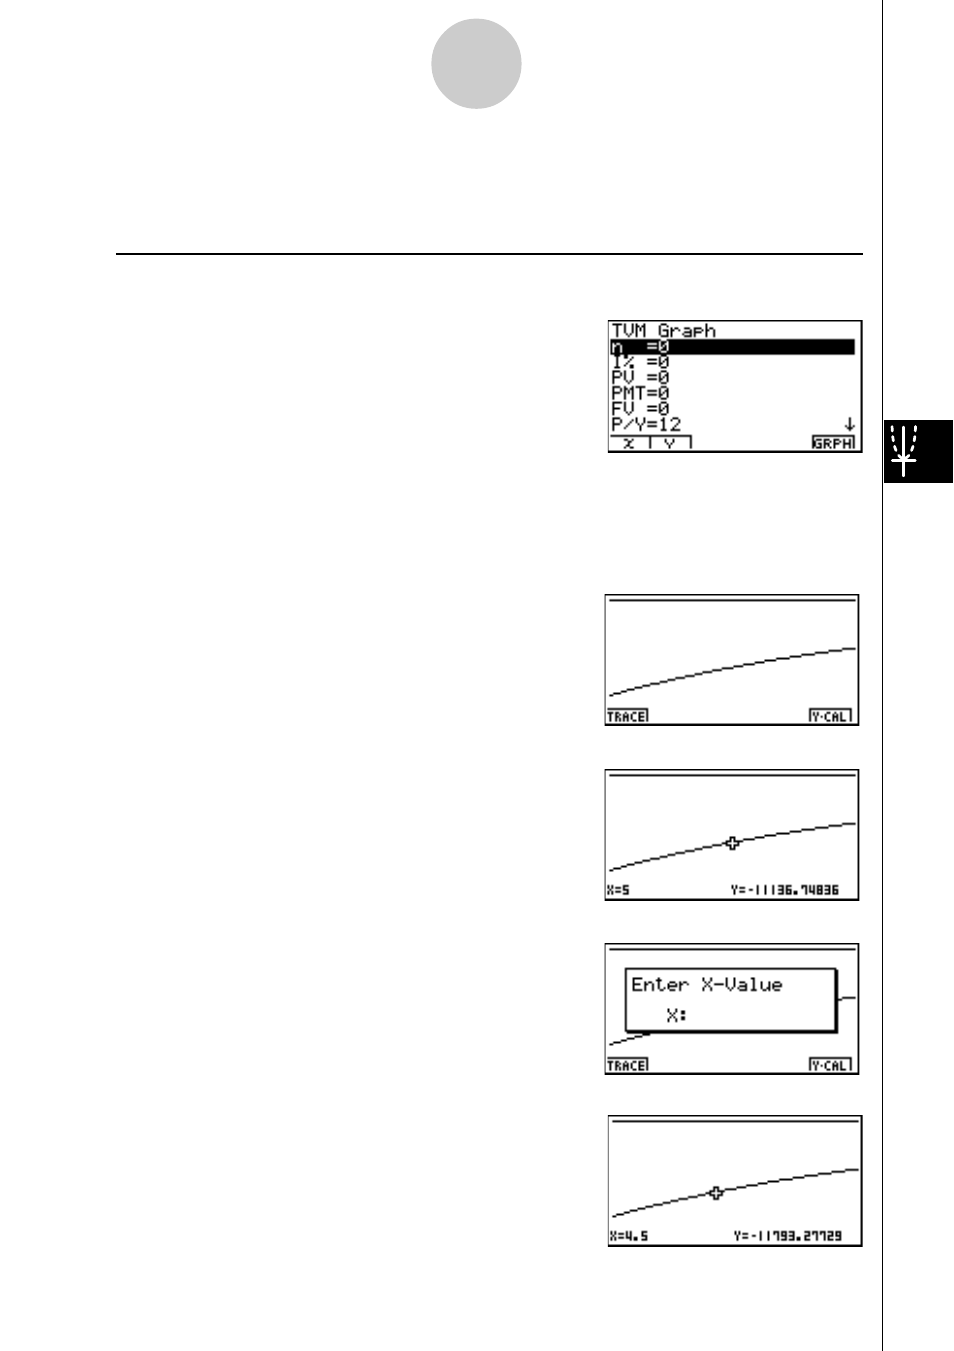
Press
5
(TVM) from the Financial 2 screen to display the following input screen for TVM
Graph.
•
6
(
g
)
5
(TVM)
After configuring the parameters, press the function keys noted below to assign parameters to
the
x
-axis and
y
-axis.
•
1
(X) ... Assigns highlighted parameter to the
x
-axis
•
2
(Y) ... Assigns highlighted parameter to the
y
-axis
After making the required settings, draw the graph.
•
6
(GRPH) ... Draws graph
After drawing a graph, you can press
1
(TRACE) to turn on trace and read calculation results
along the graph.
Press
i
to turn off trace.
Pressing
6
(Y-CAL) after drawing a graph displays the screen shown below.
Inputting an
x
-axis value on this screen and pressing
w
displays the corresponding
y
-axis
value.
Press
i
again to return to the parameter input screen.
•Calculation may take some time to perform when you specify
I
% as the
y
-axis parameter.