Casio ALGEBRA FX 2.0 Statistical Graphs and Calculations User Manual
Page 25
19990401
k
k
k
k
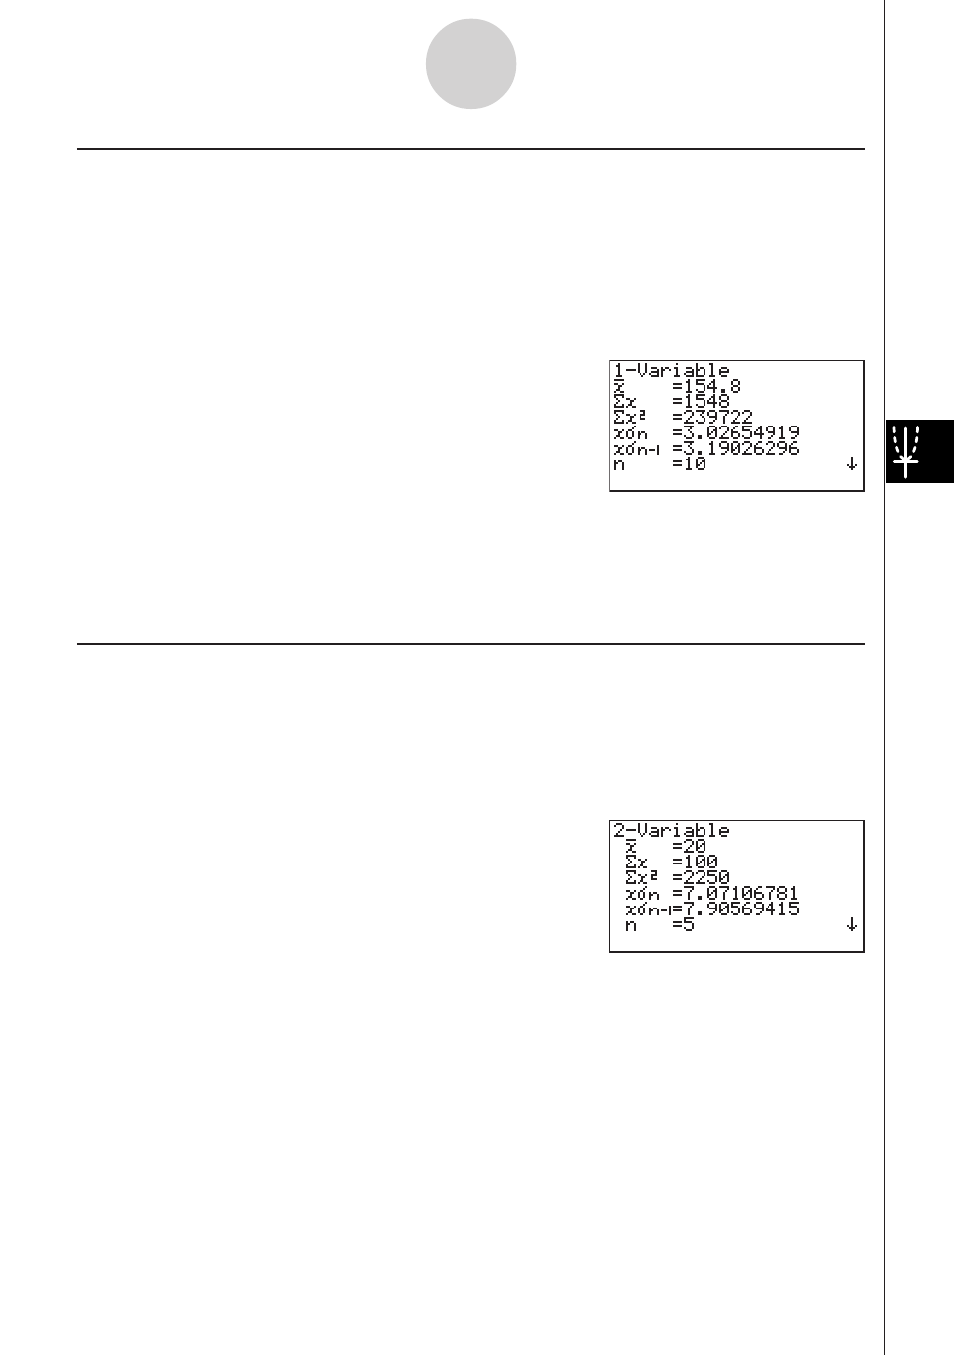
k Single-Variable Statistical Calculations
In the previous examples from “Drawing a Normal Probability Plot” and “Histogram (Bar
Graph)” to “Line Graph,” statistical calculation results were displayed after the graph was
drawn. These were numeric expressions of the characteristics of variables used in the
graphic display.
These values can also be directly obtained by displaying the statistical data list and pressing
2(CALC)b(1VAR).
After this, pressing
f or c scrolls the statistical calculation result display so you can view
variable characteristics.
For details on the meanings of these statistical values, see “Displaying the Calculation
Results of a Drawn Single-Variable Graph” (page 6-2-4).
k
k
k
k
k Paired-Varia-ble Statistical Calculations
In the previous examples from “Linear Regression Graph” to “Logistic Regression Graph,”
statistical calculation results were displayed after the graph was drawn. These were numeric
expressions of the characteristics of variables used in the graphic display.
These values can also be directly obtained by displaying the statistical data list and pressing
2(CALC)c(2VAR).
After this, pressing
f or c scrolls the statistical calculation result display so you can view
variable characteristics.
For details on the meanings of these statistical values, see “Displaying the Calculation
Results of a Drawn Paired-Variable Graph” (page 6-3-11).
6-4-2
Performing Statistical Calculations