Casio ALGEBRA FX 2.0 Statistical Graphs and Calculations User Manual
Page 13
19990401
○ ○ ○ ○ ○
Example
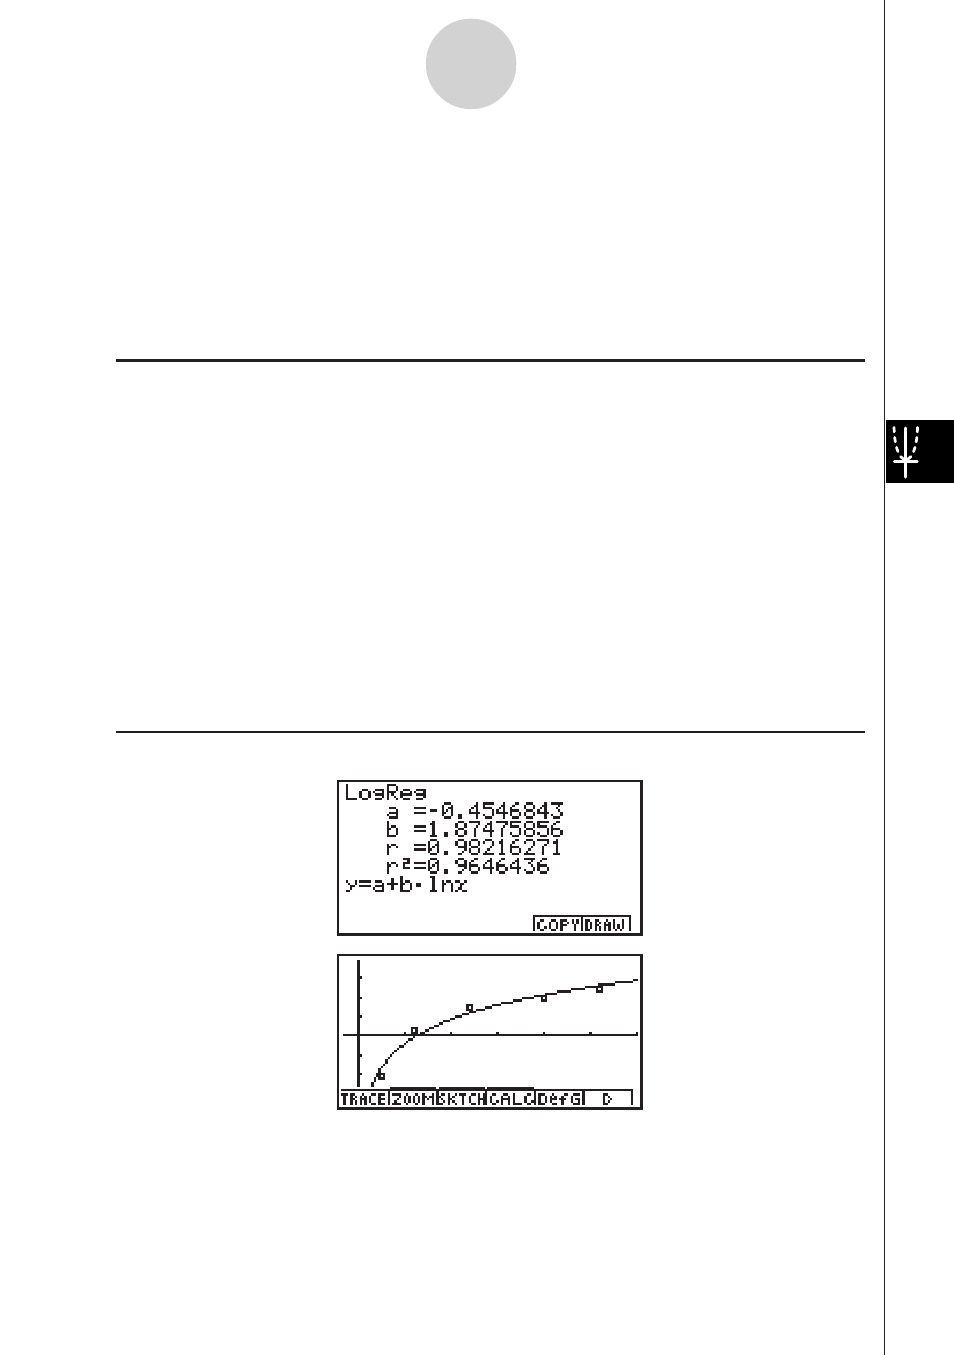
Input the two sets of data shown below and plot the data on a scatter
diagram. Next, perform logarithmic regression on the data to display
the regression parameters, and then draws the corresponding
regression graph.
0.5, 1.2, 2.4, 4.0, 5.2,
–2.1, 0.3, 1.5, 2.0, 2.4
Procedure
1
m STAT
2 a.f
wb.cw
c.e
wewf.cw
e
-c.bwa.dw
b.f
wcwc.ew
1(GRPH)f(Set)c1(Scat)i
1(GRPH)b(S-Gph1)
3
4(CALC)h(Log)
4
6(DRAW)
Result Screen
6-3-4
Calculating and Graphing Paired-Variable Statistical Data
This manual is related to the following products: