Kk quadratic/cubic/quartic regression graph – Casio ALGEBRA FX 2.0 Statistical Graphs and Calculations User Manual
Page 16
19990401
k
k
k
k
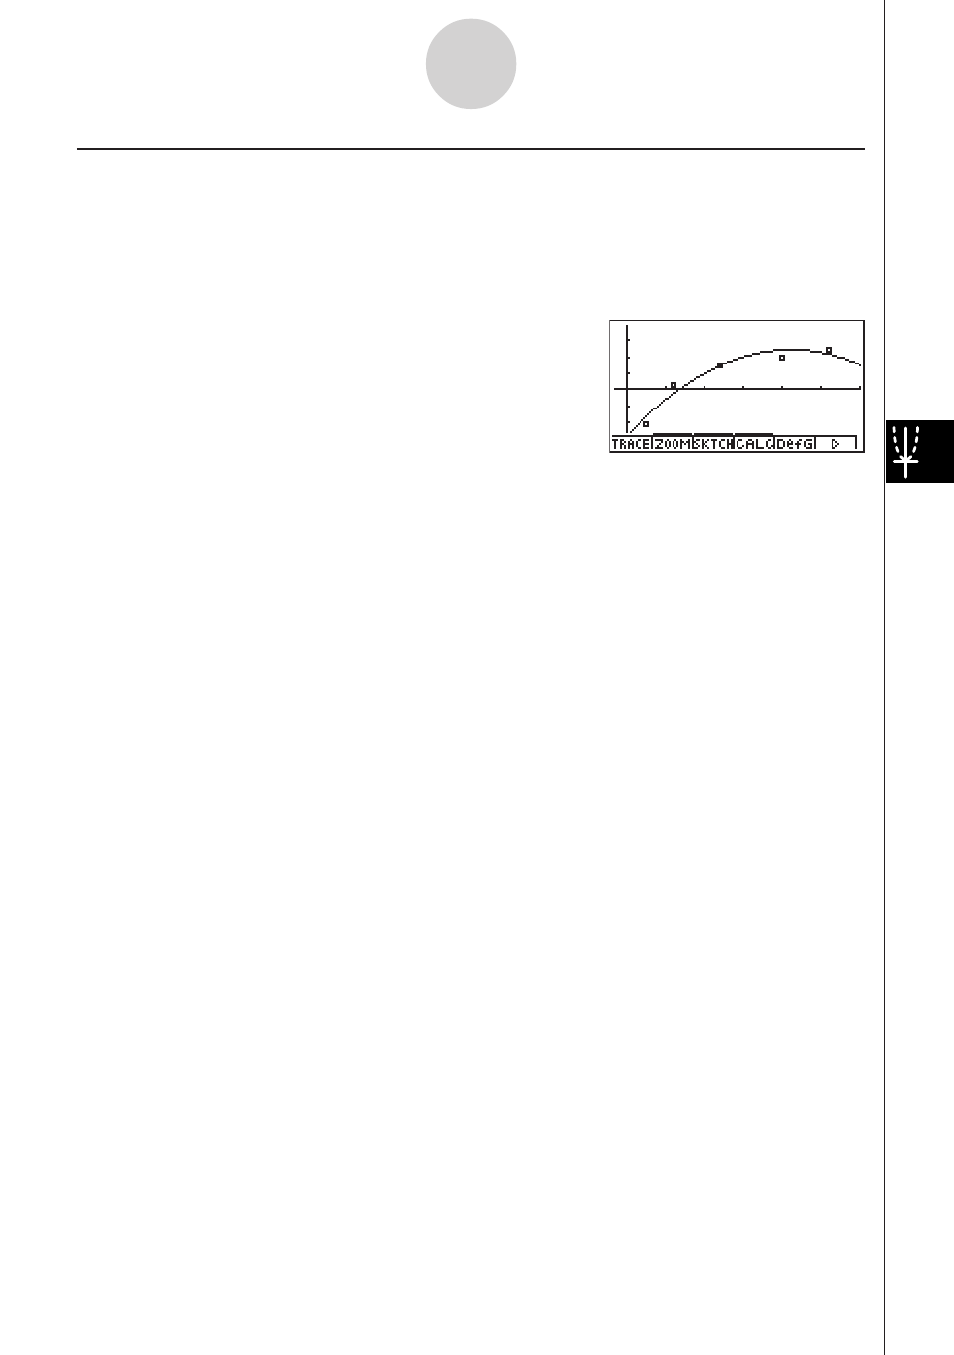
k Quadratic/Cubic/Quartic Regression Graph
A quadratic/cubic/quartic regression graph represents connection of the data points of a
scatter diagram. It uses the method of least squares to draw a curve that passes close to as
many data points as possible. The formula that represents this is quadratic/cubic/quartic
regression.
Ex. Quadratic regression
4(CALC)e(Quad)
6(DRAW)
Quadratic regression
Model formula .....
y
=
ax
2
+
bx
+
c
a .............
regression second coefficient
b .............
regression first coefficient
c .............
regression constant term (intercept)
Cubic regression
Model formula .....
y
=
ax
3
+
bx
2
+
cx
+
d
a .............
regression third coefficient
b .............
regression second coefficient
c .............
regression first coefficient
d .............
regression constant term (intercept)
Quartic regression
Model formula .....
y
=
ax
4
+
bx
3
+
cx
2
+
dx
+
e
a .............
regression fourth coefficient
b .............
regression third coefficient
c .............
regression second coefficient
d .............
regression first coefficient
e .............
regression constant term (intercept)
6-3-7
Calculating and Graphing Paired-Variable Statistical Data