Discovery list, Monitor list – Amer Networks SRPM12 User Manual
Page 13
14
Discovery List
This list displays the list of Midspans that are connected to the network.
Click the “Discovery” button to begin searching for the Midspans on the network. This process may take
some time, depending on your network configuration.
Once the Midspans have been discovered, double-click on an entry, or select a Midspan and click the
“Add to monitor list” button to move a Midspan from the Discovery List to the Monitor List.
Column Heading Definitions:
MAC Address: The Midspan’s MAC Address.
IP Address: The current IP address of the device.
Protocol version: The version of the Utility protocol.
Product Name: The Midspan’s product name.
System Name: The appointed device system name.
Location: Where the device is located.
Trap IP: The IP where Traps are to be sent.
Subnet Mask: The Subnet Mask of the device.
Gateway: The Gateway of the device.
Monitor List
To monitor a Midspan, it needs to be added to the Monitor List. You will be able to manage and view trap
events for the Midspans in this list.
System word definitions in the Monitor List:
S: The status of the Midspan; an icon ( ) before the Midspan name indicates that the Midspan is off
or not accessible.
IP Address: The current IP address of the device.
MAC Address: The Midspan’s MAC Address.
Protocol version: The version of the Utility protocol.
Product Name: The Midspan’s product name.
System Name: The appointed device system name.
Location: Where the device is located.
Trap IP: The IP where Traps are to be sent.
Subnet Mask: The Subnet Mask of the device.
Gateway: The Gateway of the device.
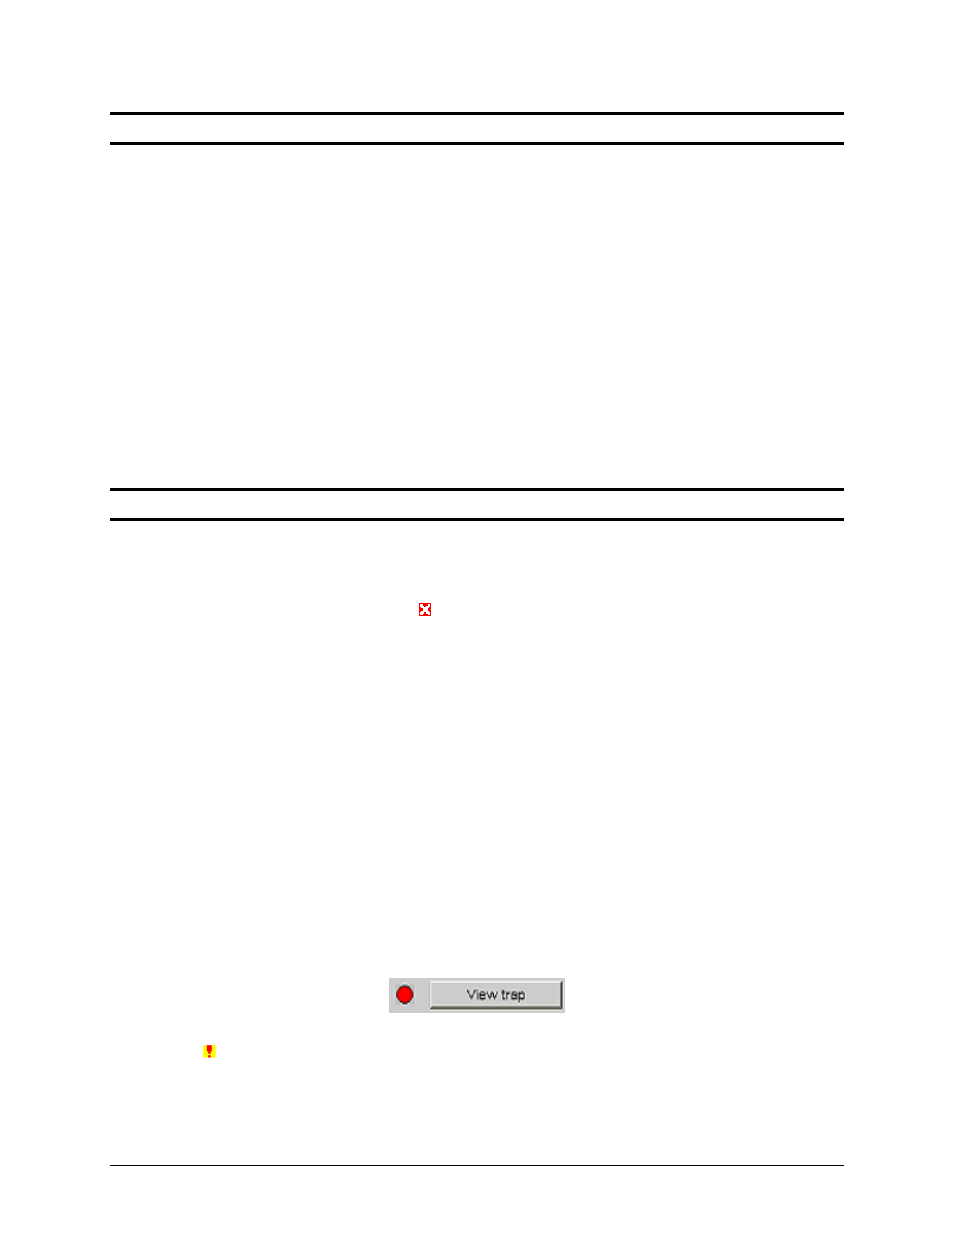
View Trap: The View Trap function allows you to view events that occur on the Midspan.
The icon beside the “View Trap” button indicates if there is a new trap that has not been viewed yet.
When the icon is green, there are no new traps available. When the icon is red, there are new traps
waiting to be viewed (Figure 10).
Figure 10 - View trap button
The symbol “ ” represents the trap signal arise, this symbol will disappear after you review and click on
When the “View Trap” button is clicked, a Trap Information window will appear showing the trap
information including the Time, Device IP and the Event that occurred (Figure 11).