2 viewing and logging process data – K-Patents FC-11 User Manual
Page 14
10
FC-11 Field Communicator instruction manual
Document/Revision No. Rev. 1.0
Effective: January 15, 2014
3.2 Viewing and logging process data
3.2.1 View measurement
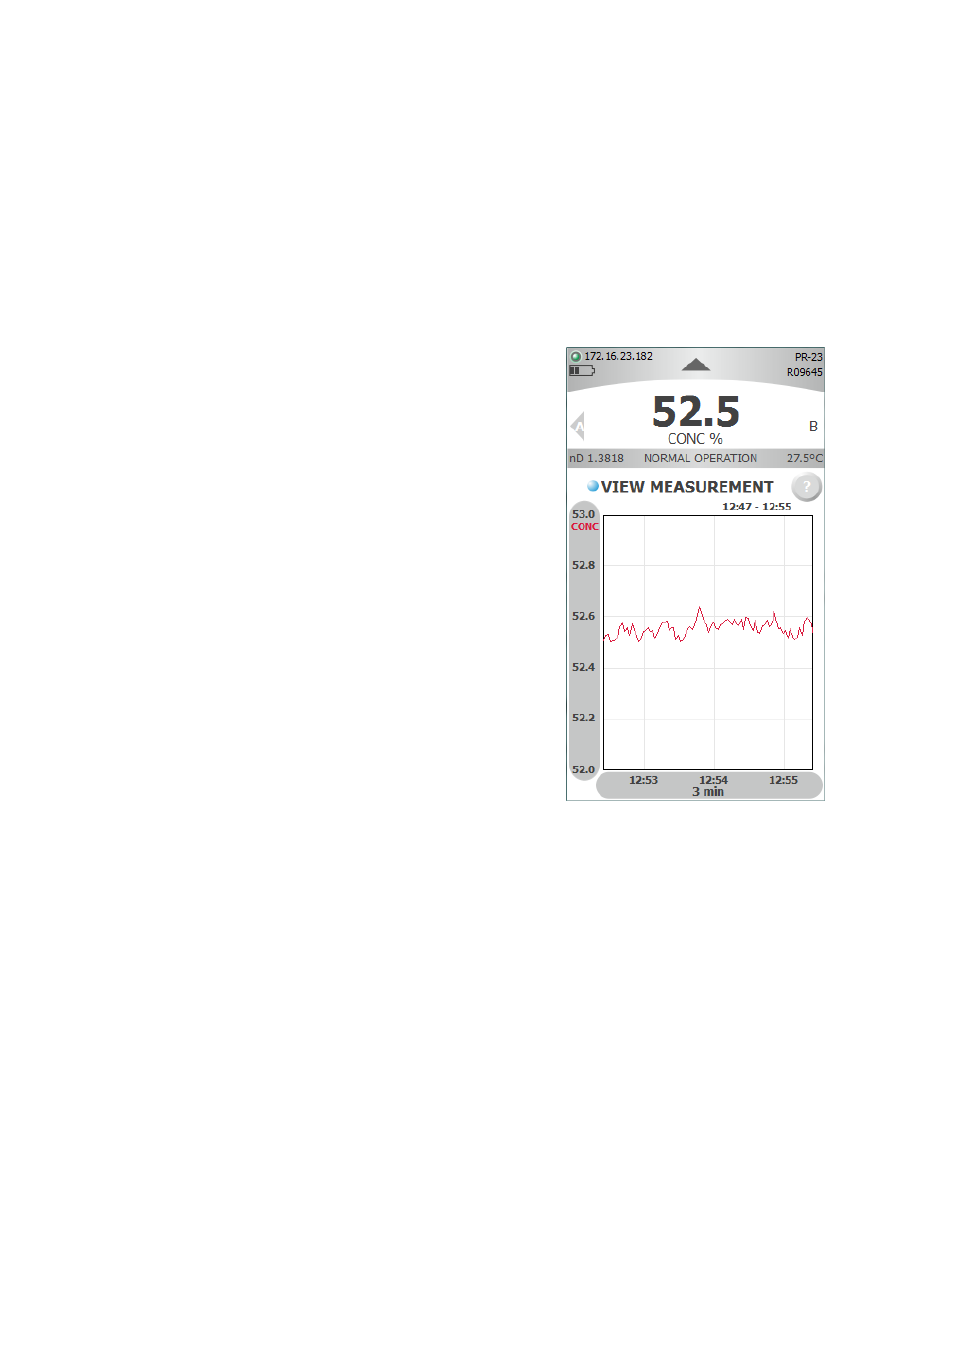
Figure 3.3
Measurement plot
To view the real-time measurement, choose
MEASUREMENT
in the main menu, then go to
VIEW MEASUREMENT
.
The plotted measurement value can be changed by touch-
ing the grey area of the y-axis. The plotted measurement
value can be either
CALC
,
CONC
,
T
or
nD
.
CALC
is the calculated
concentration value without Field calibration adjustment,
CONC
is the final concentration value including Field calibra-
tion adjustment.
T
indicates temperature, while
nD
is the
refractive index value n
D
of the sensor.
The graph is automatically scaled based on measurement
values. Time scale for the graph can be set to 3, 10 or 30
minutes. The time scale can be altered by touching on the
grey area of the x-axis. The image can be dragged horizon-
tally to see older data values.
Note: Measurement values older than 2 hrs are discarded
from the real-time view.