Data graphs, Normal runs – Etymotic ER•200DW8 Personal Noise Dosimeter with Data Logging User Manual
Page 40
40
Data Graphs
· The data graph displays dose data from the run
highlighted in the Data Table.
· To display graphs for other runs, select the run by
clicking on the line in the Data Table that contains the
run data.
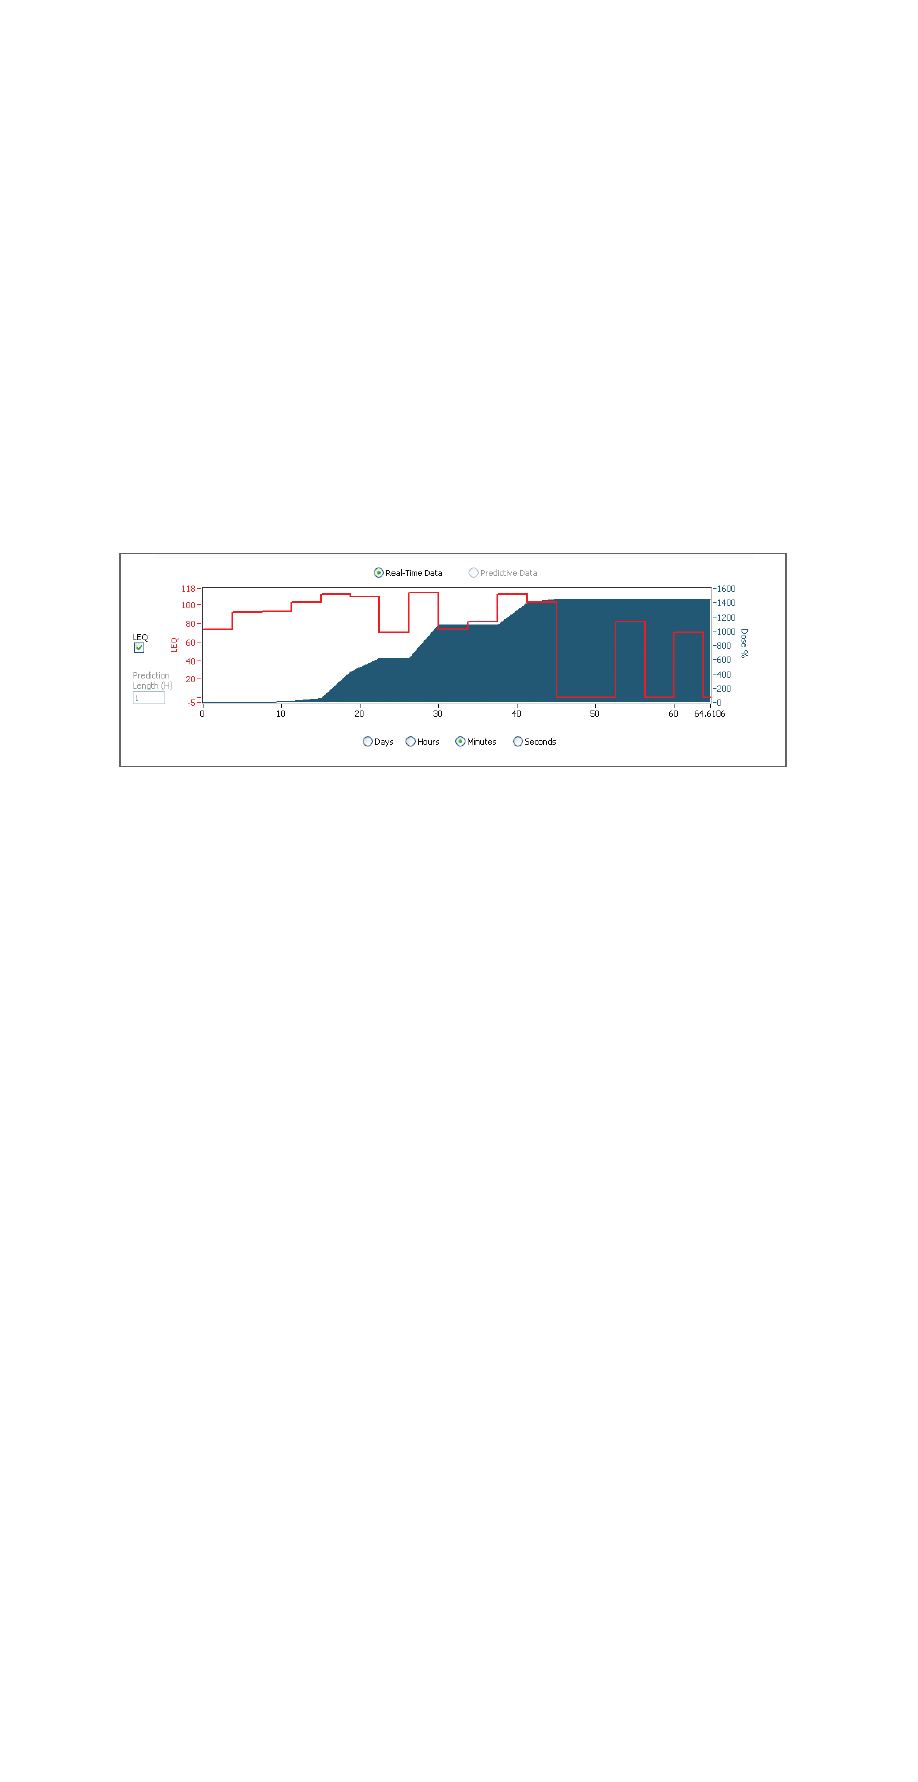
· Dose is displayed by blue fill on the graph and indicated
numerically on the right side of the graph.
Normal Runs
· Leq (Equivalent Continuous Level) is displayed on the
left side of the graph and indicated with a red line on
the graph when the Leq box is checked. Leq is only
available for Real-Time Data.
· For Normal runs, only Real-Time Data are available.
· In Normal Mode, dose values are obtained every
220 msec and summed over a 3.75 minute interval.
Leq (red)
Dose % (blue)