ABUS Technologies Log Box-DA Data Logger User Manual
Page 22
ABUS TECHNOLOGIES INC.
22
Log Box-DA
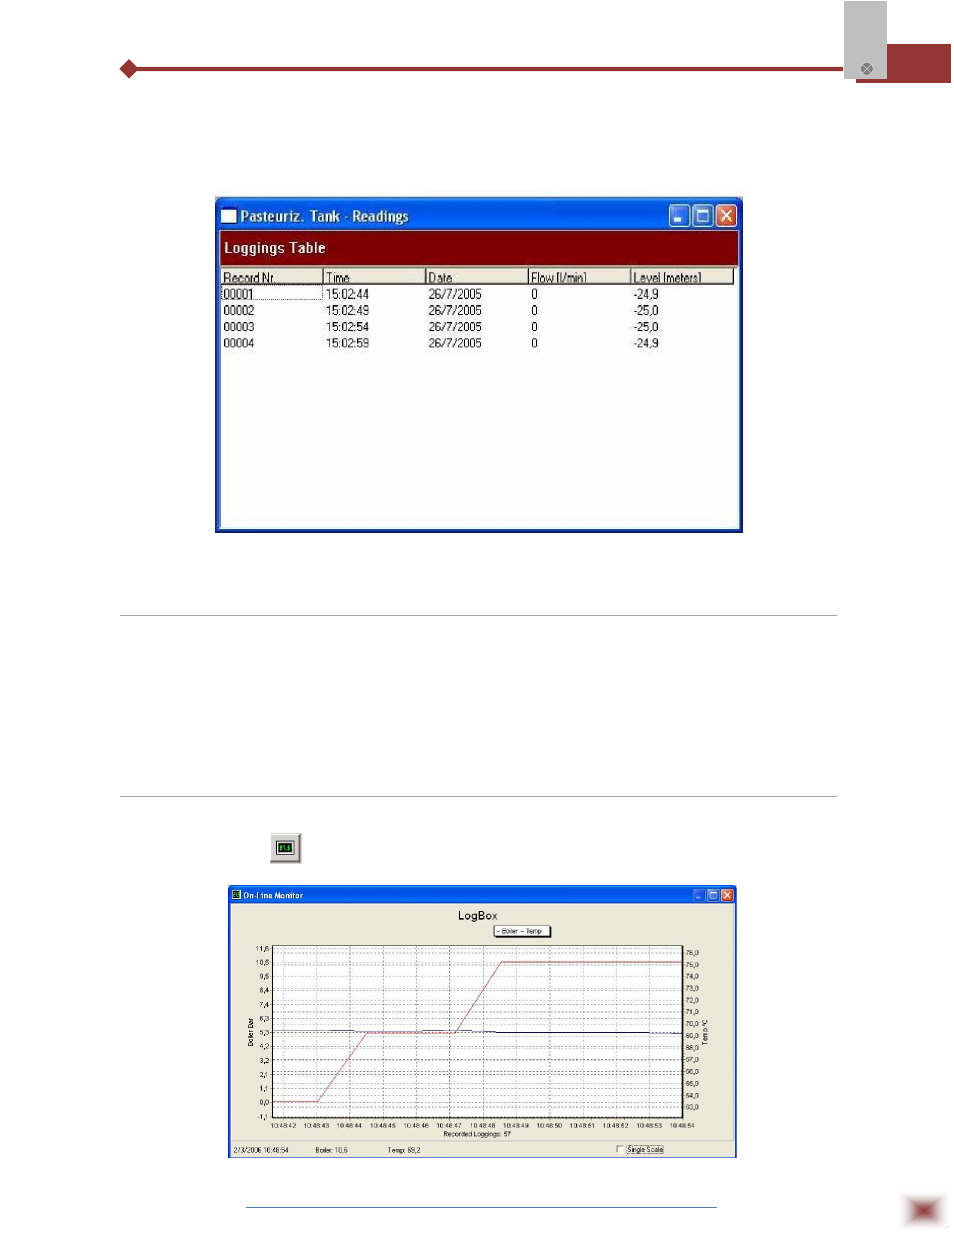
7.1.3 ACQUISITIONS TABLE WINDOW
Here is the Data acquired and is presented in engineering units in a table format. The table
displays register number, date/time and the record values.
Screenshot showing the acquisitions table
7.2 Visualization Data
Three windows support data visualization: Graph, Acquisitions Table and General Information
windows. Data can be originated from direct reading from the logger or from a file previously recorded in
a computer. Once the windows are open, data can be saved in a file (.lch), printed on a graph or
exported to a text file (.txt or .dat).
7.3 Monitoring Acquisitions
To visualize current measurements in a graph format, use the Monitor On-Line command by
clicking on the button
, while pointing the IR-LINK3 interface to the logger.
Online monitoring graph