Hanna Instruments HI 23 User Manual
Page 14
27
26
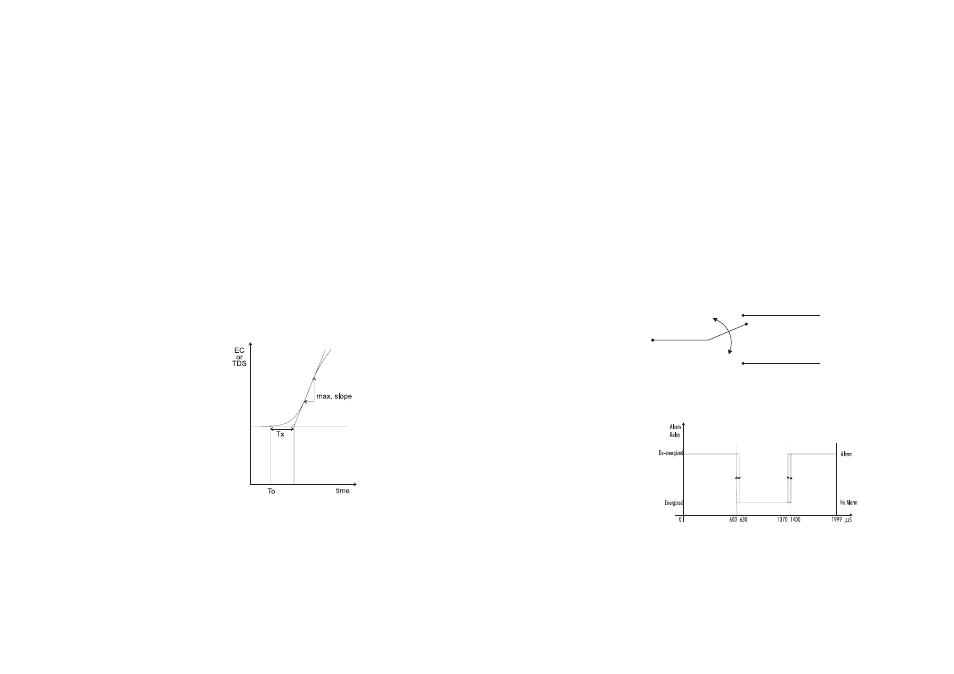
4. The deviation, Ti and Td can be calculated from the following:
• Deviation = Tx * max. slope (EC/TDS)
• Ti = Tx / 0.4 (minutes)
• Td = Tx * 0.4 (minutes).
5. Set the above parameters and restart the system with the
controller in the loop. If the response has too much over-
shoot or is oscillating, then the system can be fine-tuned
slightly increasing or decreasing the PID parameters one
at a time.
Note
Connecting an external device (e.g. chart recorder) to the
controller, the procedure is easier and doesn’t need to hand
plot the process variable (EC or TDS).
ALARM RELAY
The alarm relay functions in the following manner:
During alarm condition, the relay is de-energized. When
not in alarm condition, the relay is energized.
Example:
High alarm set at 1400
µ
S
Low alarm set at 600
µ
S
An hysteresis will eliminate the possibility of continuous se-
quences ‘energizing/de-energizing’ the alarm relay when
the measured value is close to the alarm setpoint. The alarm
hysteresis amplitude is 1.5% of full scale.
FS•O = NC (Normally Closed)
De-energized Relay
COM
FS•C = NO (Normally Open)
Energized Relay
The user can vary five different parameters, i.e. the setpoint
(S1 or S2), the deviation (D1 or D2), the reset time, the rate
time and the proportional control mode period T
c
(from 1
to 30 minutes).
Note
User can disable the derivative and/or integrative action
(for P or PI controllers) by setting Td = 0 and/or Ti = MAX
(Ti) respectively through the setup procedure.
SIMPLE TUNING PROCEDURE
The following procedure uses a graphical technique of ana-
lyzing a process response curve to a step input.
1. Starting from a solution with an EC or TDS value quite
different from the dosed liquid, turn on the dosing device
at its maximum capacity without the controller in the loop
(open loop process). Note the starting time.
2. After some delay (T
0
) the EC or TDS starts to vary. After
more delay, the EC or TDS will reach a maximum rate of
change (slope). Note the time that this maximum slope
occurs and the EC or TDS value at which it occurs. Note
the maximum slope in EC or TDS per minute. Turn the
system power off.
3. On the chart draw a tangent to the maximum slope point until
intersection with the horizontal line corresponding to the initial
EC or TDS value. Read the system time delay Tx on the time
axis.