Figure 1 figure 2 figure 3 figure 4 – Elenco Deluxe Solar Educational Kit User Manual
Page 2
2
The two halves of the solar cell, one “P” type silicon and the other “N” type silicon, cancel
each other out to produce a neutral cell.
When sunshine penetrates to the junction of the “N” type and “P” type silicon cell layers it
creates a flow of electrons throughout the crystal structure. The crystal structure of silicon
contains empty areas which will accept electrons. As one electron moves to fill a hole, it creates
another hole. It is this flow of electrons which produces electricity.
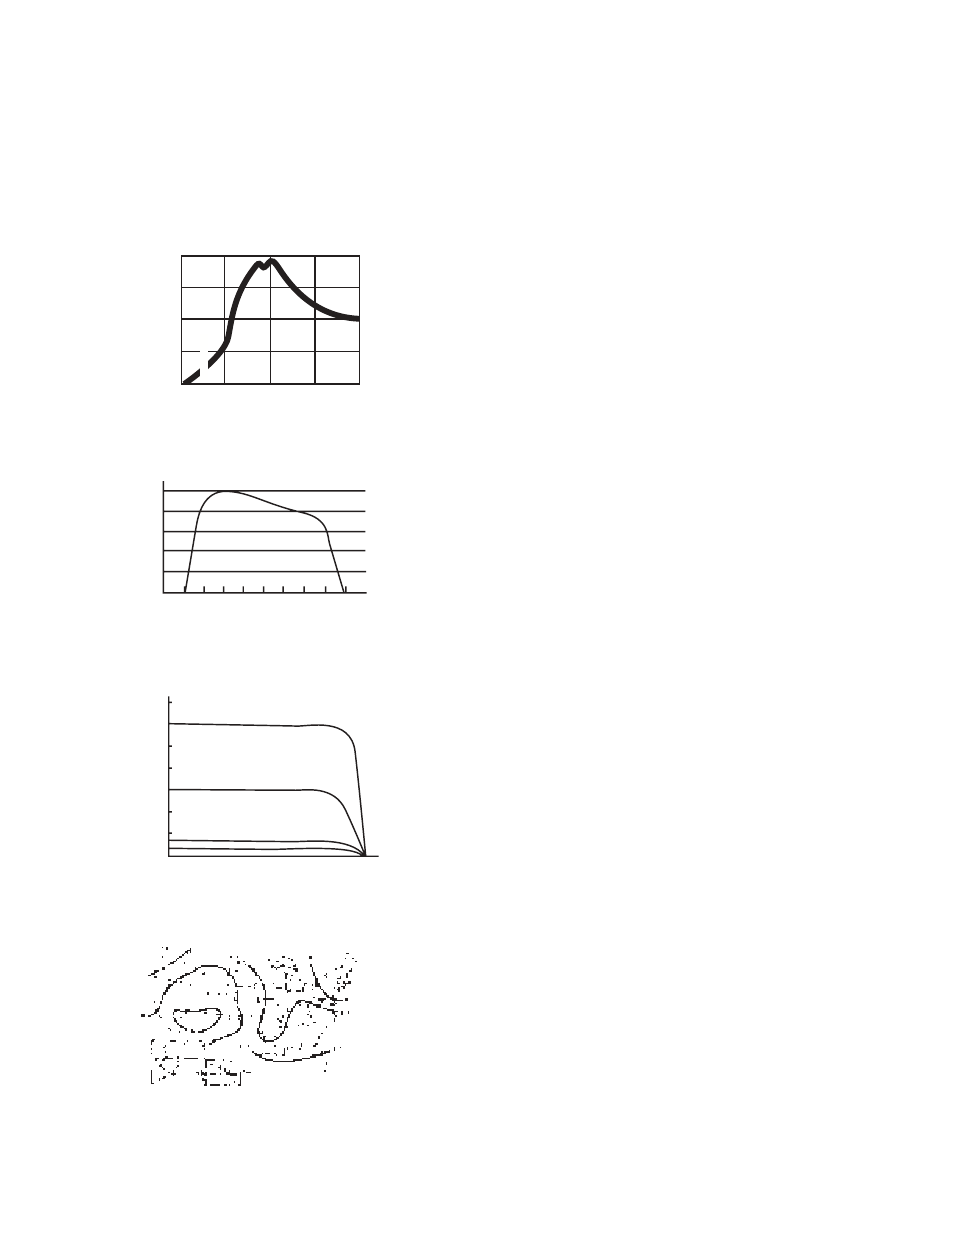
In most circumstances, solar cells are not
exposed to maximum levels of sunlight. Figure 3
shows the resulting output of a solar cell when
exposed to maximum and lesser amounts of
sunlight. Notice that the terminal voltage is not
significantly effected by the amount of light.
The relative response of a typical silicon solar
cell across the light spectrum is represented in
figure 2. As we can see from this chart, silicon
solar cells have a high response over a broad
range of wavelengths.
Sunlight contains many colors of light. Color
and the relative power in each color of light is
determined by the measure of the wavelength.
Figure 1 plots the relationship between
wavelengths and color along the spectral
distribution of ordinary daylight.
The average number of peak sun hours per
day varies from one area of the country to
another. Figure 4 shows the yearly average peak
sun hours and in turn the potential for solar
energy applications for different parts of the
country.
UL
TRA
VIOLET
VIOLET
BLUE
GREEN
YELLOW
ORANGE
RED
INFRARED
300
350
400
450
500
550
600
650
700
20
40
60
80
100
RELA
TIVE POWER
WAVELENGTH(NANOMETERS)
300
500
700
900
1100
REL. RESP %
100
U LT R AV I O L E T
V I S I B L E
I N F R A R E D
WAVELENGTH(NANOMETERS)
1 SUN
0.5 SUN
0.1 SUN
0.05 SUN
V O LTA G E
CURRENT
FIGURE 1
FIGURE 2
FIGURE 3
FIGURE 4