Elenco PK101 w/ Computer Interface User Manual
Page 10
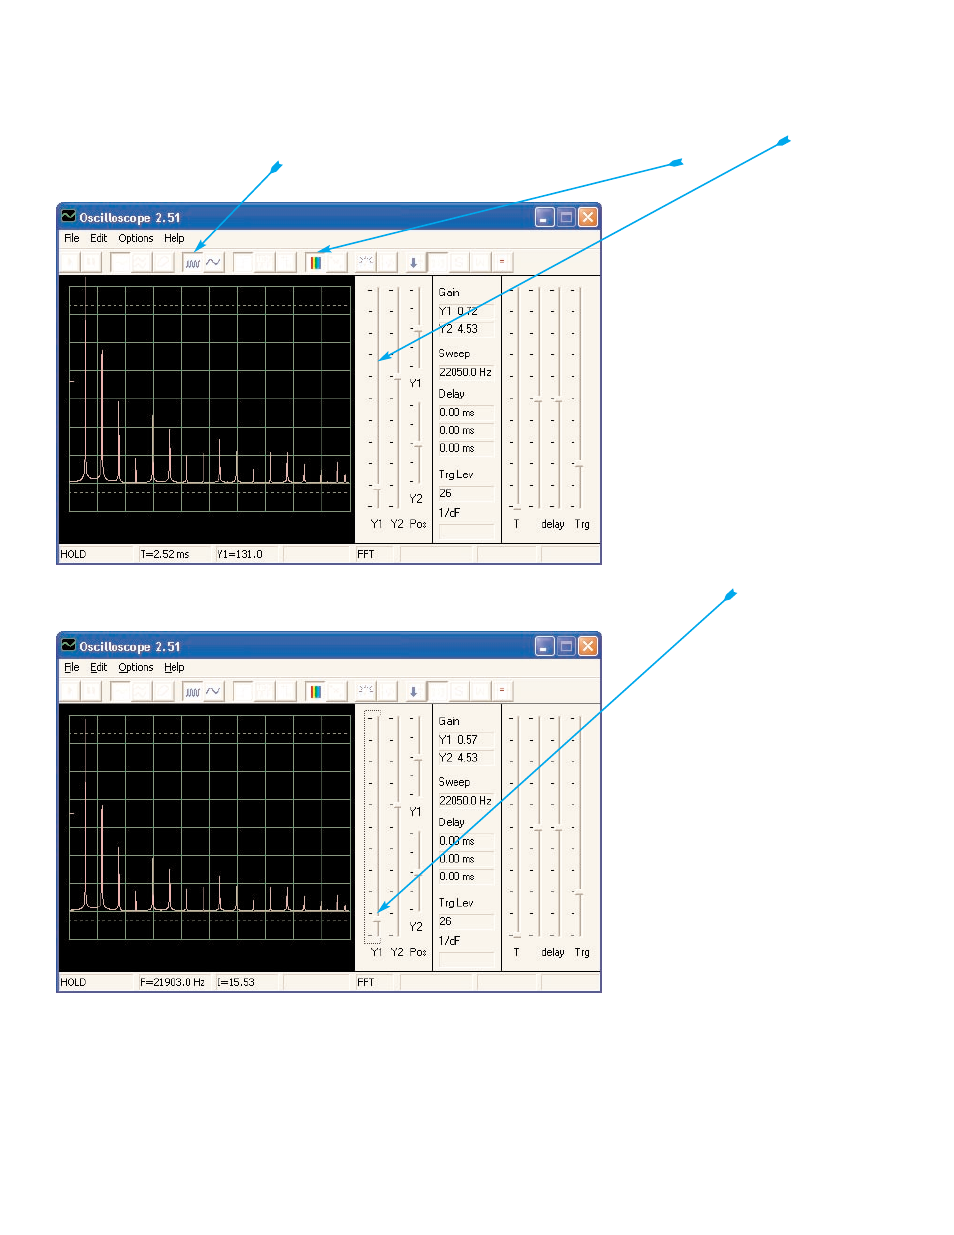
Now its time to look at your electronic signal in a different way. The oscilloscope features you have
been using show you voltage (amplitude) vs time, now you will see voltage vs frequency. Engineers
use expensive instruments called spectrum analyzers to do this, but Winscope uses a mathematical
transformation called an FFT to do this. Set the Y1 gain control back to its default position for now.
Click on the 5ms/div button to display a wider range, then click on the FFT button. Your display
should be similar to this:
You are seeing the frequency
spectrum of your signal, up to 22
KHz. Notice that most of the ener-
gy is at the low frequencies
(below 7 KHz), and there is very
little as you go higher.
The 1:1 gain mode does not apply to the FFT screen, so move the Y1 gain control down to here so
you can see the peak energy at the low frequencies.
Move the variable resistor control
and watch how it changes the fre-
quencies on the display.
-10-
- Upgrade Kit SC100 to SC300 (76 pages)
- Snap Circuits Jr.® Educational 100 Exp. (48 pages)
- Upgrade Kit SC300 to SC500 (64 pages)
- Snap Rover ® (24 pages)
- XP&trade (64 pages)
- Snap Circuits LIGHT ® (84 pages)
- Snap Circuits Extreme® Educational 750 Exp. (88 pages)
- Projects PC1-PC73 (60 pages)
- Electronics 202 (132 pages)
- Snaptricity® (92 pages)
- Upgrade Kit SCROV10 to SCROV50 (48 pages)
- Snap Circuits Green ® (80 pages)
- C Adapter for Snap Circuits® (2 pages)
- Motion Detector Kit (20 pages)
- Digital Roulette Kit (16 pages)
- FM Wireless Microphone Kit (12 pages)
- AM Radio Kit (32 pages)
- AM Radio Kit (36 pages)
- AM/FM Radio Kit (64 pages)
- Circuit Maker Skill Builder 125 (64 pages)
- Circuit Maker Sound Plus 200 (80 pages)
- Understanding Logic Gates (16 pages)
- Understanding Logic Gates and Circuits (42 pages)
- Tumbling Robot (12 pages)
- Solar Energy (16 pages)
- C2D Scope (16 pages)
- 288x Astrolon Telescope with Aluminum Tripod (1 page)
- Simulated Frog Dissection Kit (1 page)
- Talking Galaxy Planetarium with Night Light (1 page)
- Night’n Day® (10 pages)
- Radio Controlled Black Widow (1 page)
- Handheld Microscope (2 pages)
- Water Filtration Kit (8 pages)
- 6-in-1 Solar Kit (18 pages)
- Microscope Set in Carrying Case (1 page)
- Mobile 20 Telescope (1 page)
- Mechanical Drum (20 pages)
- Aerial Screw (20 pages)
- Swing Bridge (20 pages)
- Printing Press (24 pages)
- MultiBarrel Cannon (20 pages)
- Armored Car (24 pages)
- Paddleboat (20 pages)
- SelfPropelled Cart (20 pages)
- Catapult (24 pages)