ChemoMetec SP-100 User Manual
Page 29
4 Analysis tab
19
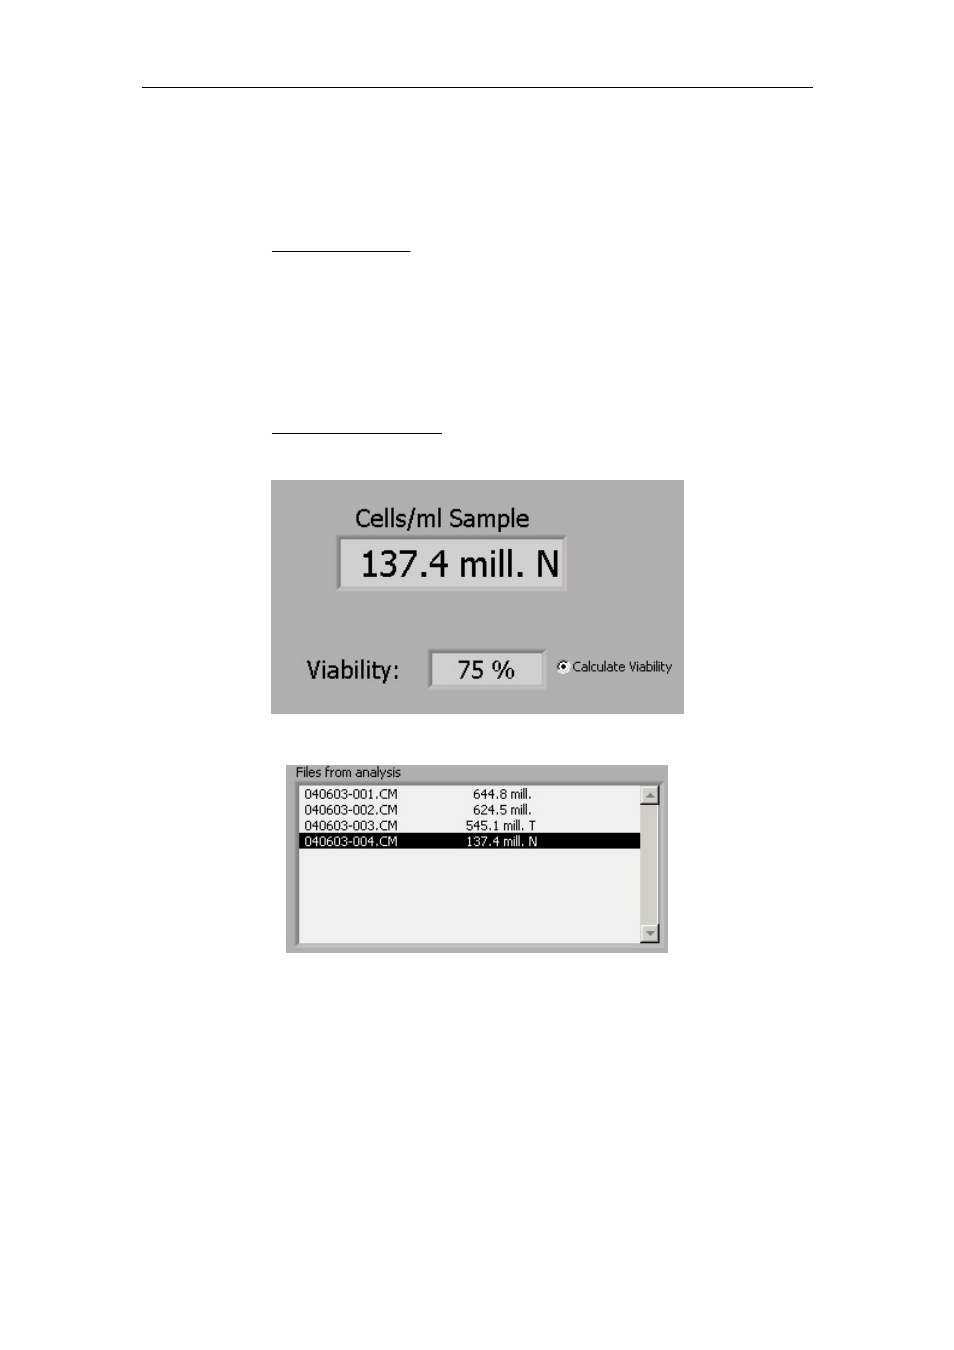
marked the SemenView program will find the file from the first valid Total analysis
listed before (above) the Non-viable file selected, from the file list.
The Viability is calculated as:
%
Total
Nonviable
Total
100
Viability
−
⋅
=
Please refer to your NucleoCounter SP-100 User's Guide for reference on how to perform
Viability analysis.
In the case presented here the Viability becomes:
%
75
%
mill
1
.
545
mill
4
.
137
mill
1
.
545
100
Viability
=
−
⋅
=
Figure 24 Calculate Viability check-button, Viability result and the Non-Viable result.
Figure 25 File list showing Non-viable (N) and Total (T) samples.
The program will remember the status of the Calculate Viability check-button when it is
running. The default value is un-checked.
4.8
Collected image - Image data field.
When estimating cell concentration with the NucleoCounter SP-100, an image of the
stained nuclei in the SP1-Cassette chamber is collected. This image is transferred to the
computer and SemenView presents it. The image bears resemblance to a starry sky,
where each of the stars is a stained nucleus. Figure 26 shows an example of an image
displayed by SemenView.