Ca b d – JDC Electronic SA Geos 11 SkywatchLog User Manual
Page 5
- 5 -
3. VIEW HISTORIC
Once the data is uploaded, all data can be viewed on
the graph.
A) Line graph for each set of data
B) Scale for each data line
C) Time and date
D) Selection of data displayed
Use the checkboxes in (D) to select which data to
view. Use the dropdown boxes to select which data to
show for that color. Note that six or fewer sets of data
can be displayed. If one box is changed to a
measurement already listed in a different box, that box
will automatically switch to another measurement.
Select “Modes [Zoom Axis]” to select zoom or scroll
when using the mouse. Click and drag the mouse to
zoom or scroll the graph, timeline, or scale.
To save the data to a file, select FILES -> SAVE
To open a saved file (.geo or .new) from the software,
go to
FILES -> OPEN.
4. VIEW REAL TIME DATA
To view and record data in real time. Select WINDOW
-> Real Time Historical or Console Real Time. If data
is displayed, the program will prompt to save the
current file before starting a new record.
Select REAL TIME -> Record Real Time to start
recording the GEOS 11 in real time. Note that the
GEOS 11 does not have to be “ON” for information to
be displayed and stored. This is useful for saving
battery life on the GEOS.
The “Console” view will display the measurements on
weather dials. Select what is displayed on each dial by
selecting from the drop down menus.
The “Real Time Historical Record” will display the
same graph as in historical, but the data points will be
added and the graph will scroll from right to left.
You can choose “Auto-Save” when entering the Real
time mode to automatically save the data, preventing
from loss of data. This data can then be opened to
view or export at a later time
To stop Real Time mode, select REAL TIME -> Stop
Real Time
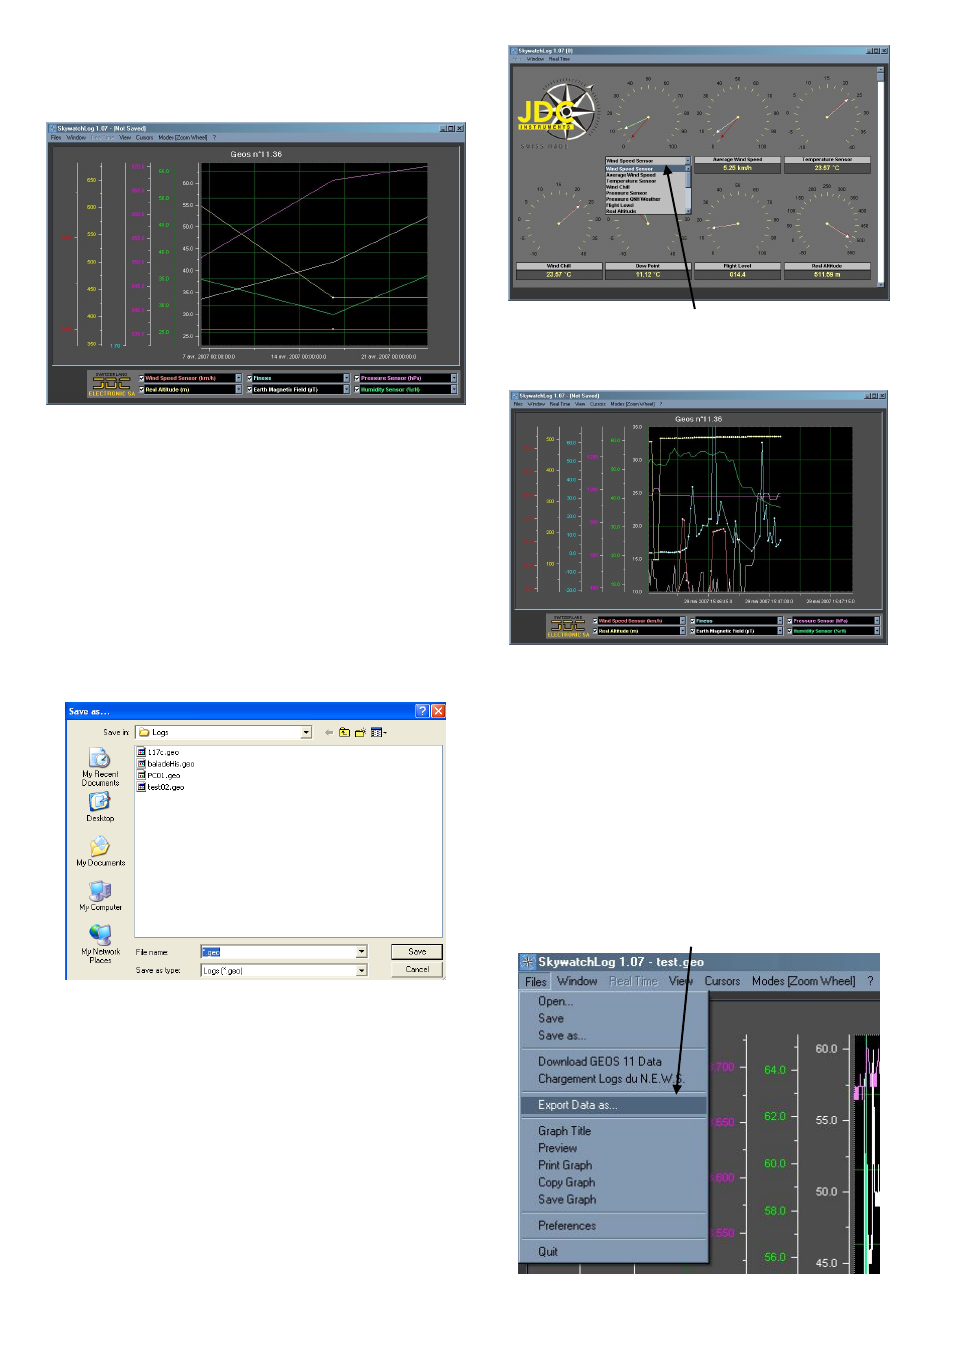
5. EXPORT DATA
You can export data on different formats than the ones
specific to SkywatchLog. Go to
FILES -> EXPORT
DATA AS…
C
A
B
D