Casio fx-50F PLUS User Manual
Page 52
E-51
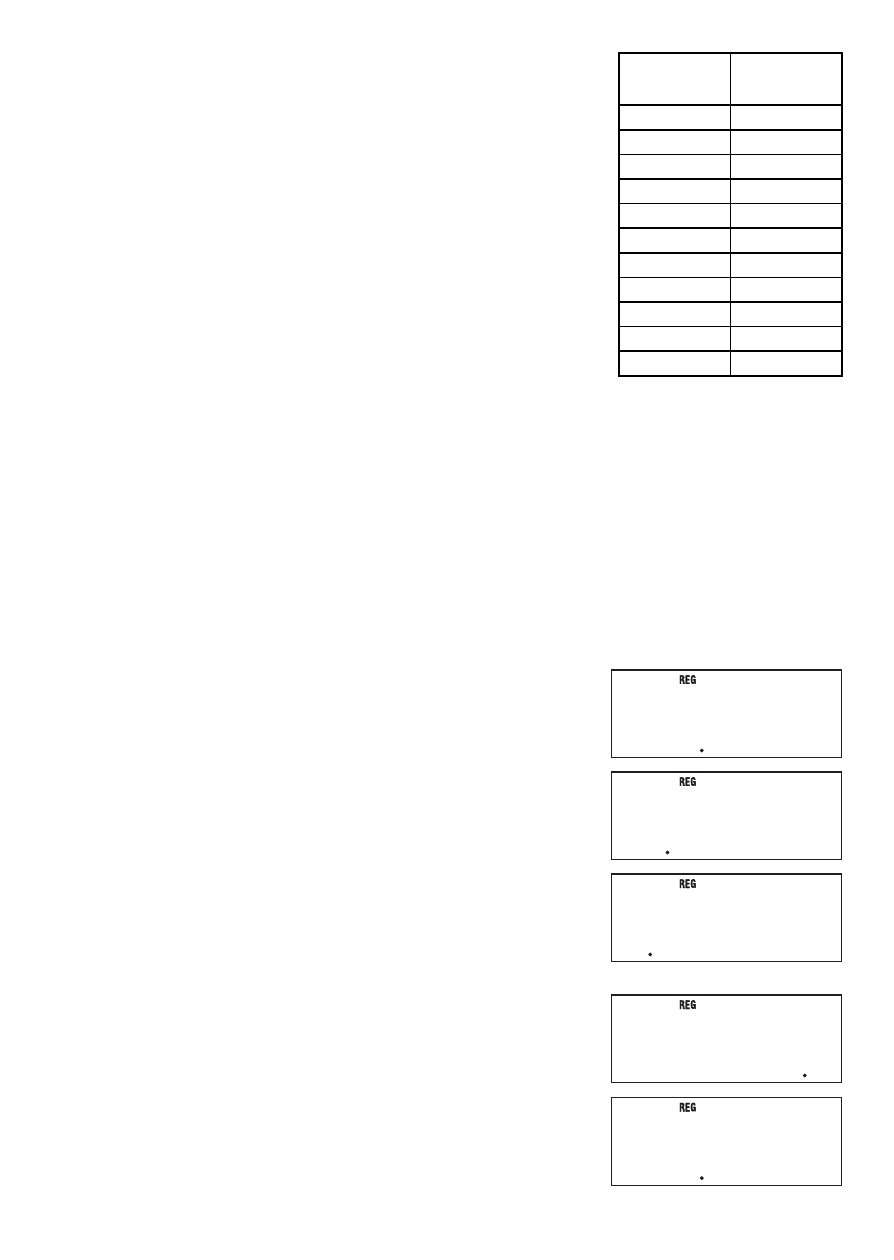
Example 2: The nearby data shows how the weight of a
newborn at various numbers of days after birth.
1 Obtain the regression formula and correlation coeffi cient
produced by linear regression of the data.
2 Obtain the regression formula and correlation coeffi cient
produced by logarithmic regression of the data.
3 Predict the weight 350 days after birth based on the
regression formula that best fi ts the trend of the data in
accordance with the regression results.
Operation Procedure
Enter the REG Mode and select linear regression:
N5(REG)1(Lin)
Select FreqOff for the statistical frequency setting:
1N(SETUP)dd2(FreqOff)
Input the sample data:
20,3150m(DT)50,4800m(DT)
80,6420m(DT)110,7310m(DT)
140,7940m(DT)170,8690m(DT)
200,8800m(DT)230,9130m(DT)
260,9270m(DT)290,9310m(DT)
320,9390m(DT)
1 Linear Regression
Regression Formula Contant Term a:
12(S-VAR) 1(VAR) ee1(a)E
Regression Coeffi cient b:
12(S-VAR) 1(VAR) ee2(b)E
Correlation Coeffi cient:
12(S-VAR) 1(VAR) ee3(r)E
2 Logarithmic Regression
Select logarithmic regression:
12(S-VAR) 3(TYPE)2(Log)
Regression Formula Contant Term a:
A12(S-VAR) 1(VAR) ee1(a)E
a
4446575758
a
4446575758
b
1887575758
b
1887575758
r
0904793561
r
0904793561
20
x
1 =
20
x
1 =
a
–4209356544
a
–4209356544
Number
of Days
Weight
(g)
20
3150
50
4800
80
6420
110
7310
140
7940
170
8690
200
8800
230
9130
260
9270
290
9310
320
9390