Bio-Rad Precision Melt Analysis™ Software User Manual
Page 4
Software Navigation
Double click the desktop icon (Figure 2), or select
Start >
Programs > Bio-Rad > Precision Melt Analysis. To navigate
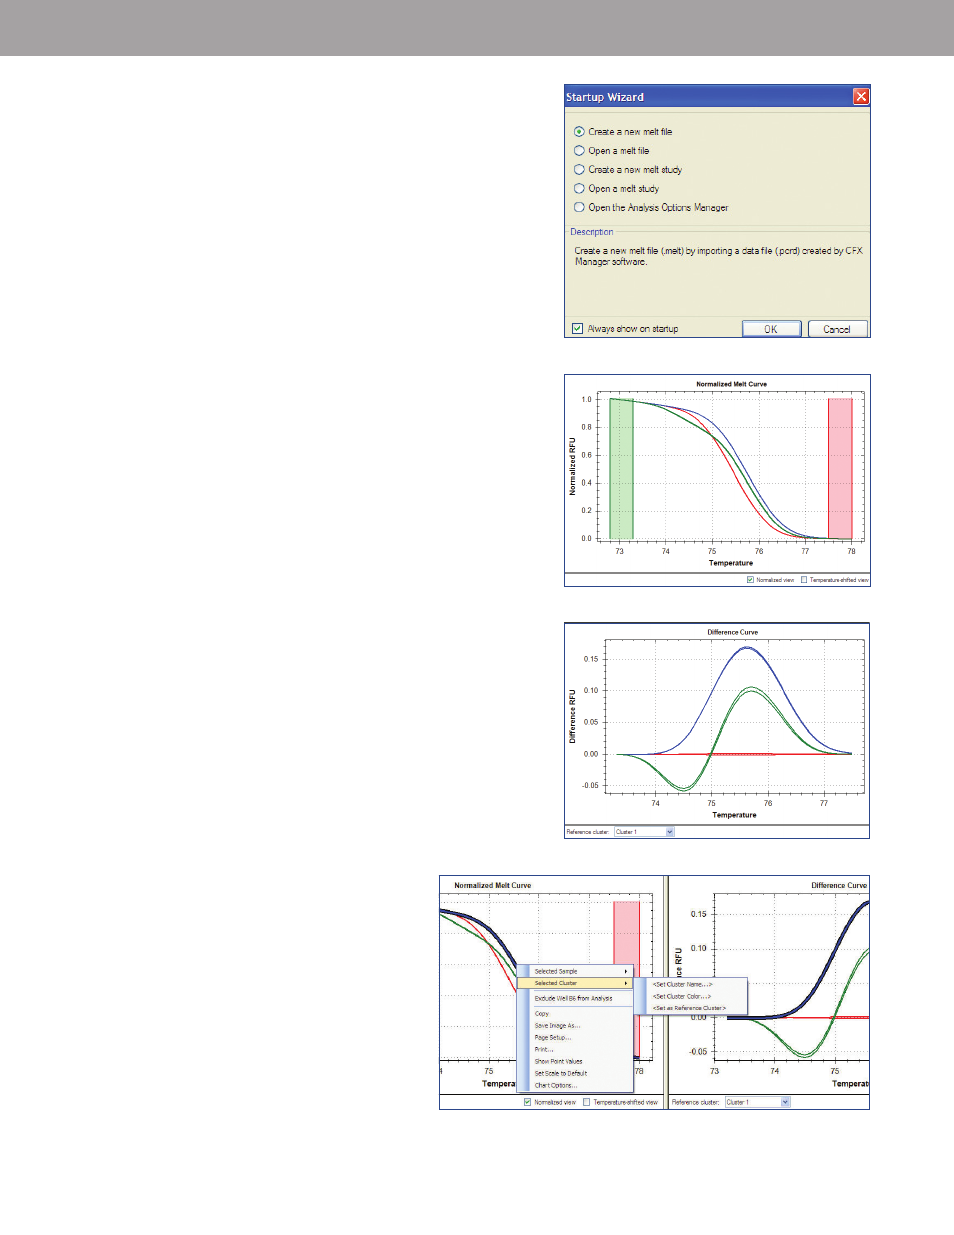
within the software, use the Startup Wizard (Figure 6), which
provides quick access to common software commands found
in the menu bar and the toolbar.
Converting a Data File to a Melt File
To convert a data file to a melt file, select
Create a new melt file
in the Startup Wizard (Figure 6), or select
File > New > Melt File
from the File menu. Choose the data file, then click
Open.
To open an existing melt file, select
Open a melt file in the
Startup Wizard (Figure 6), or select
File > Open > Melt File
from the File menu.
Analyzing and Viewing Data
Precision Melt Tab
When you open a melt file in the Precision Melt Analysis software,
the software uses the default analysis settings to assign a cluster
to each sample. To analyze the data in the different panes:
1. In the Melt Curve pane, select the
Normalized view checkbox
to compare all the curves with the same starting and ending
fluorescent signal level applied. Two cursors per region are
provided, defaulted to the ends of the curve, as shown in
Figure 7.
2.
Optional: In the Melt Curve pane, select Temperature-
shifted view to apply a temperature shift to each normalized
fluorescence curve along the temperature axis (x-axis) (Figure 7).
3. For easy visual identification of clusters, Precision Melt Analysis
software generates a difference curve for each well (Figure 8).
The Difference Curve chart shows the difference in fluorescence
between a well and the fluorescence of a reference curve.
4. Right click the fluorescence trace of a well in the Melt Curve
or Difference Curve chart to change the selected sample or
selected cluster parameters (Figure 9).
Tip: Right click the spreadsheet for options. Export the data
in the spreadsheet by right clicking and selecting the
Export to
Excel option.
Fig. 8. Difference Curve pane.
Fig. 9. Changing cluster parameters.
Fig. 7. Melt Curve pane.
Fig. 6. Startup Wizard in Precision Melt Analysis software.