Bio-Rad Precision Melt Analysis™ Software User Manual
Page 3
4. In the Protocol tab, select
Create New to open the Protocol Editor.
5. Create the protocol in Table 2.
6. Click
OK to save the protocol and return to the Run Setup window.
7. Click the
Plate tab.
8. Click the
Select Existing > Sample files > MeltCalibration folder,
select the appropriate plate name based on your instrument and plate
type, then click
Open.
n
For a 96-well system, select
Melt Calibration Plate_96 wells_
Clear or Melt Calibration Plate_96 wells_White
n
For a 384-well system, select
Melt Calibration Plate_
384 wells_White
9. Click the
Start Run tab.
10. Select the instrument in the Start Run on Selected Blocks list
by clicking the checkbox to the left of the instrument name.
11. Load the melt calibration plate into the instrument.
12. Click
Start Run to begin running the experiment on the
selected block.
13. At the prompt, save the name of the melt calibration data file as
Melt Calibration_run date, for example, Melt Calibration_081412.
14. When the melt calibration run is complete, CFX Manager
software automatically opens and processes the data file.
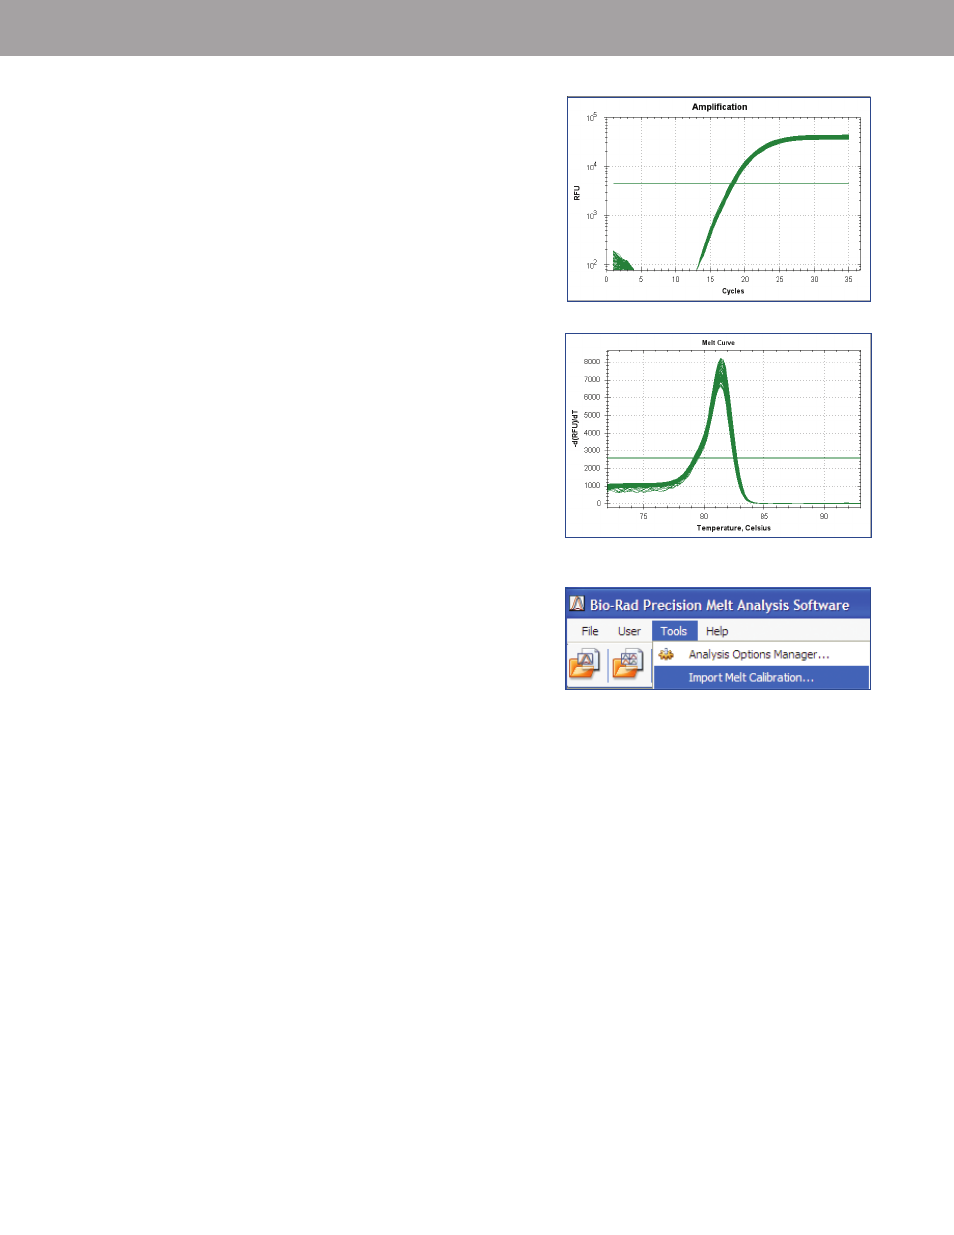
Check the data file to ensure all wells display a tight
amplification and a single melt peak (Figure 4).
Importing a Melt Calibration File
Precision Melt Analysis software is used to open data files that
have been generated from an experiment performed on a CFX96,
CFX96 Touch, CFX96 Touch Deep Well, CFX Connect, CFX384, or
CFX384 Touch real-time PCR detection system and analyzed using
CFX Manager software. To open and generate a melt calibration
file using Precision Melt Analysis software:
1. Launch Precision Melt Analysis software by double clicking
the Precision Melt Analysis software icon on the Desktop.
2. Click
Tools > Import Melt Calibration from the Menu bar (Figure 5).
3. Choose the name of the melt calibration experiment data file (.pcrd
extension) and click
Open.
4. A window will appear indicating the calibration was successful.
5. Click
OK to proceed and use Precision Melt Analysis software.
Fig. 4. Melt calibration data. A, amplification plot; B, melt
curve plot with a single peak.
B
A
Fig. 5. Import Melt Calibration file.