Color sensitivity, Figure 7. object beyond cutoff – problem, Figure 8. object be – Banner WORLD-BEAM QS18 Laser Series User Manual
Page 4: Yond cutoff – solution, Figure 5. reflective, Background – problem, Figure 6, Reflective background – solution, Figure 8. object beyond cutoff – solution, Figure 5. reflective background – problem
E = Emitter
R1 = Near Detector
R2 = Far Detector
Cutoff
Distance
Reflective
Background
Sensing
Field
Core of
Emitted
Beam
Strong
Direct
Reflection
to R1
E
R2
R1
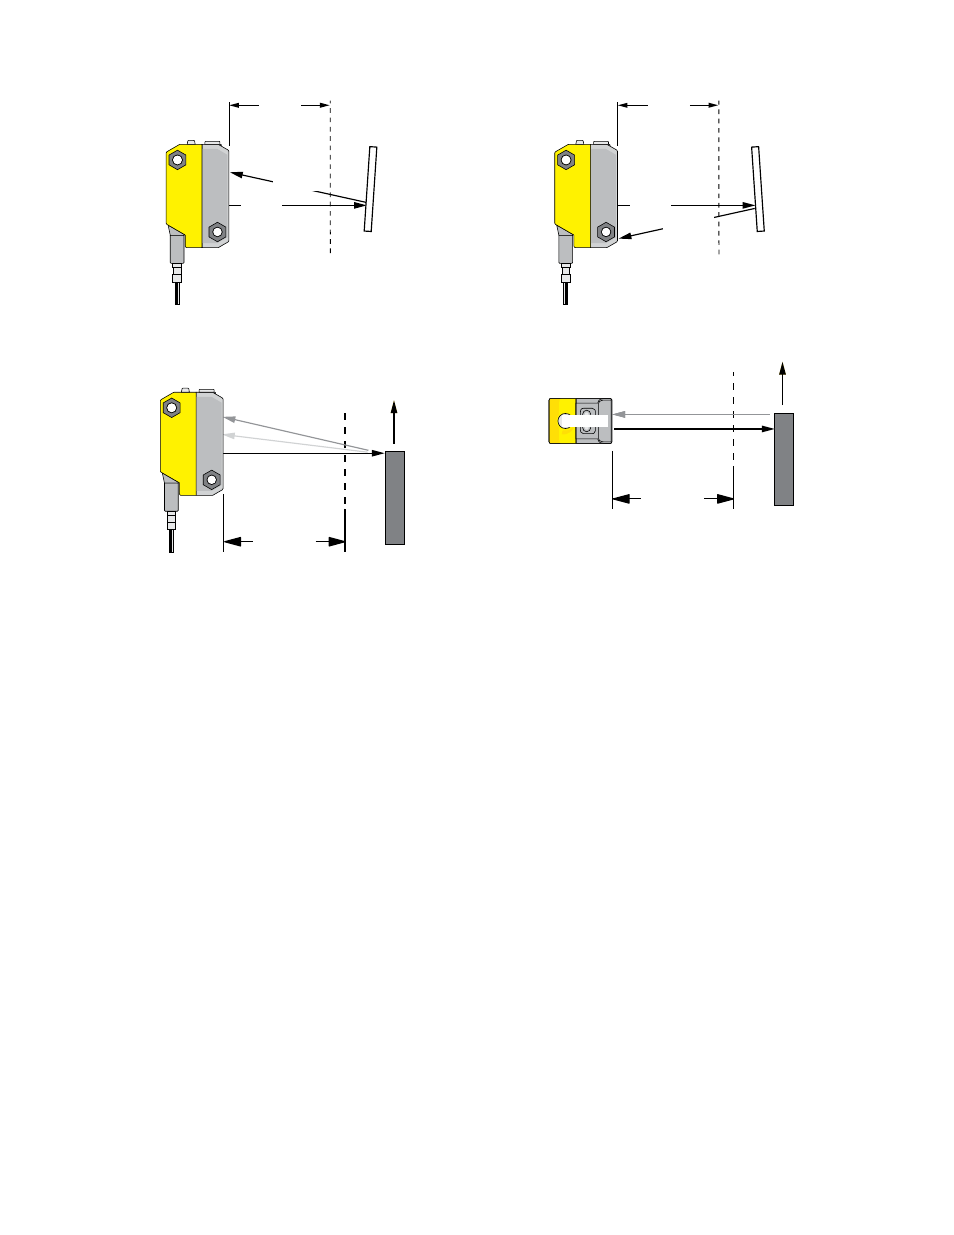
Figure 5. Reflective background – problem
E = Emitter
R1 = Near Detector
R2 = Far Detector
Cutoff
Distance
Reflective
Background
Sensing
Field
Core of
Emitted
Beam
Strong
Direct
Reflection
Away From
Sensor
E
R2
R1
Figure 6. Reflective background – solution
E
R2
R1
Sensing
Field
Cutoff
Distance
Figure 7. Object beyond cutoff – problem
A reflective background object in this position or moving across the
sensor face in this axis and direction may cause false sensor re-
sponse.
R1, R2,E
Sensing
Field
Figure 8. Object beyond cutoff – solution
A reflective background object in this position or moving across the
sensor face in this axis will be ignored.
Color Sensitivity
The effects of object reflectivity on cutoff distance, though small, may be important for some applications.
The excess gain curves were generated using a white test card of 90% reflectance. Objects with reflectivity of less than 90% reflect less
light back to the sensor, and thus require proportionately more excess gain in order to be sensed with the same reliability as more reflec-
tive objects. When sensing an object of very low reflectivity, it may be especially important to sense it at or near the distance of maximum
excess gain.
It is expected that at any given cutoff setting, the actual cutoff distance for lower reflectance targets will be slightly shorter than for higher
reflectance targets (see the cutoff point deviation graphs). This behavior is known as color sensitivity.
In the cutoff point deviation graphs, the percentage of deviation indicates a change in the cutoff point for either 18% gray or 6% black
targets, relative to the cutoff point set for a 90% reflectance white test card.
For example, in
Figure 9. QS18AF cutoff point deviation
on page 5, the cutoff point decreases 10% for a 6% reflectance black target
when the cutoff point is adjusted for 100 mm (4 in) using a 90% reflectance white test card. In other words, the cutoff point for the black
target is 90 mm (3.6 in) for this setting.
WORLD-BEAM® QS18 Adjustable-Field Sensors
4
www.bannerengineering.com - tel: 763-544-3164
P/N 66981_web
Rev. I