Figure 5, Area / transfer time diagram – Metrohm Inline Dialysis User Manual
Page 23
■■■■■■■■■■■■■■■■■■■■■■
4 Operation and maintenance
IC equipment: Dialysis
■■■■■■■■
17
0.0
2.0
4.0
6.0
8.0
10.0
12.0
10
15
20
25
30
35
40
45
Fluoride
Chloride
Nitrite
Bromide
Nitrate
Phosphate
Sulfate
Fluoride
Chloride
Nitrite
Bromide
Nitrate
Phosphate
Sulfate
Transfer time [sec]
Ar
ea [µS/cm*min]
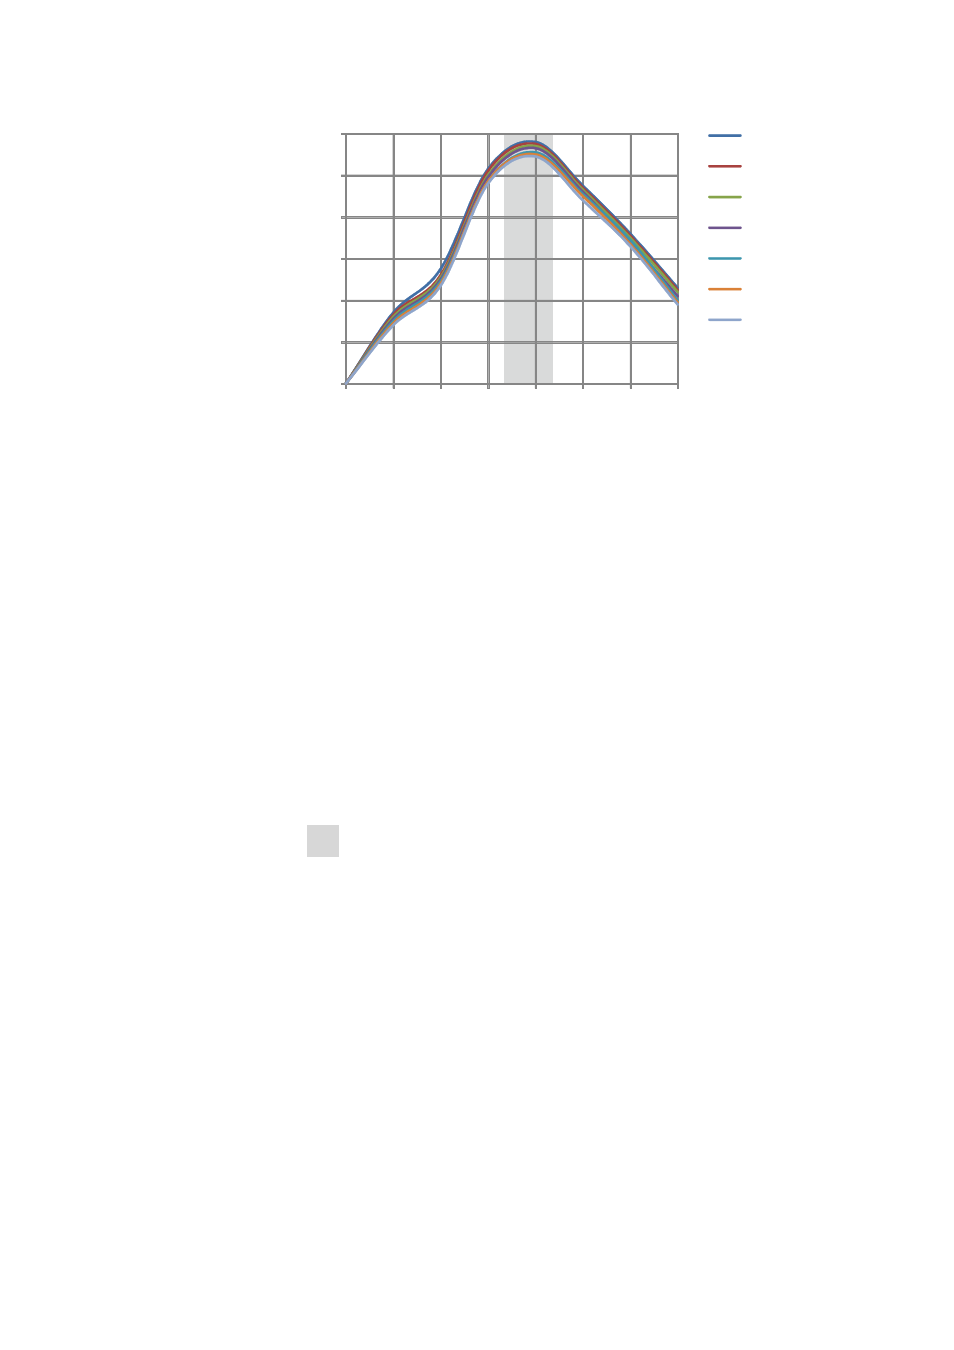
Figure 5
Area / transfer time diagram
According to this curve, the optimum transfer time is between 27
and 32 seconds.
Determining the dialysis time
After the optimum transfer time has been established, the optimum dialy-
sis time must be determined. This time depends on the total ion concen-
tration in the sample.
The dialysis time is the time during which the acceptor flow is stopped
and only sample is pumped. This time must be chosen in such a way that
100% of the sample concentration is achieved in the acceptor solution.
For the dialysis membrane (6.2714.010) (cellulose acetate; thickness =
115 µm; pore size = 0.2 µm) and a total ion concentration
≥ 5 mg/L in the
sample, the standard dialysis time value is 10 minutes.
This standard value must be verified for each installation.
1 Measuring the standard solution without dialysis
■
Remove the capillary that is connected to the dialysis cell outlet
for the acceptor solution (3-6) and immerse it in a standard solu-
tion with approximately the same total ion concentration as the
sample.
■
In the software, start a determination that measures the standard
solution directly (i.e. without dialysis).
■
Reconnect the capillary to the dialysis cell outlet for the acceptor
solution (3-6) and rinse the acceptor channel for two minutes.
■
In the software, stop the peristaltic pump for the acceptor chan-
nel.