Bayer HealthCare Ascensia Contour Blood Glucose Monitoring System User Manual
Page 31
27
0
100
200
300
400
500
600
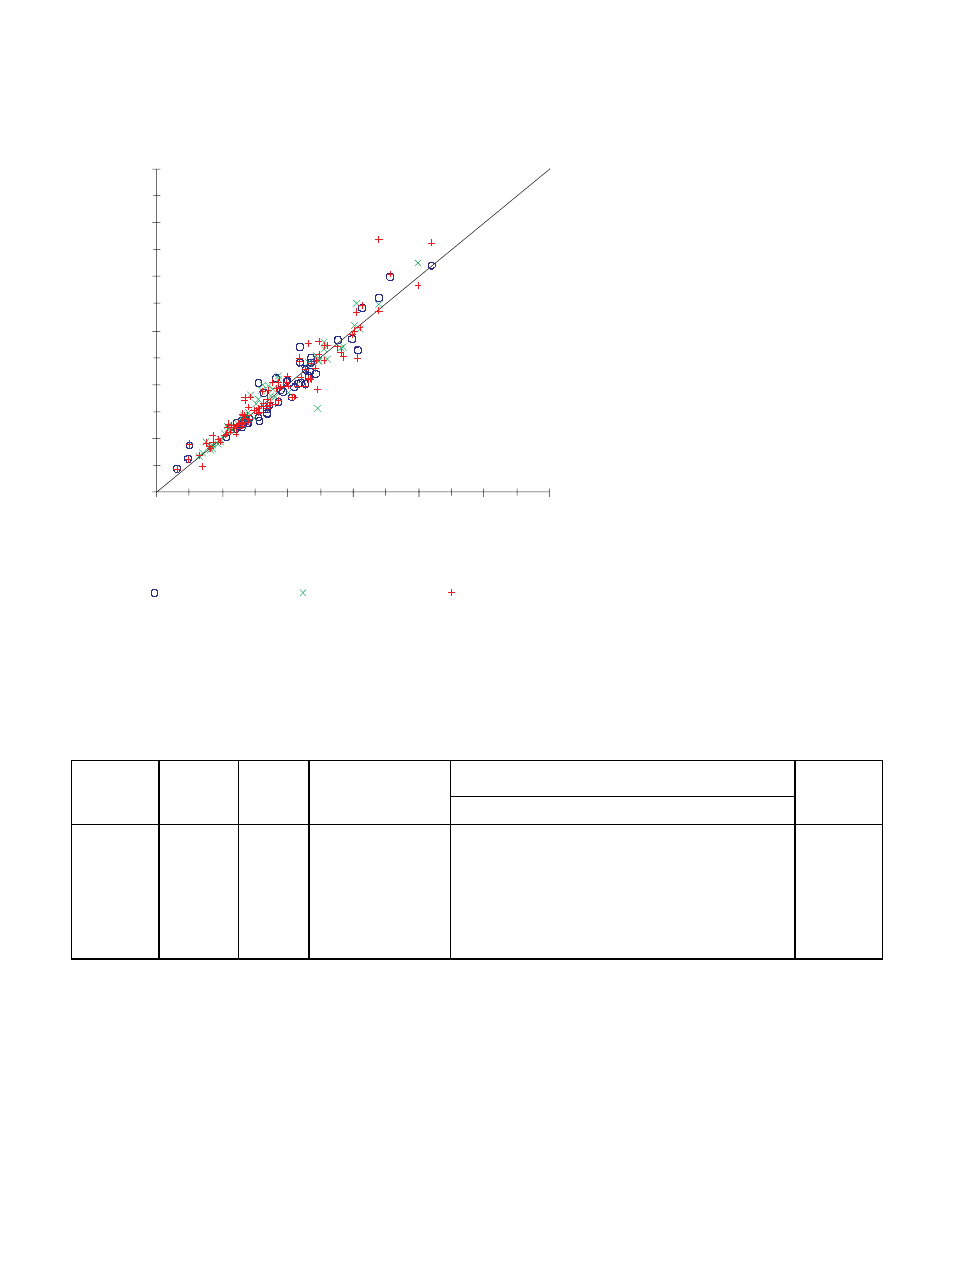
y=x
Lot 22B
Lot 22C
Lot 23B
0
100
200
300
400
500
600
Plasma Comparative Method Glucose Result (mg/dL)
Ascensia
C
ONTOUR
Result (mg/dL)
B. Health Care Professional Results
Reagent
95% Confidence Interval
Lot
Opr.
n
y =
Slope
/
Intercept
r
22B
Lay
50
1.03x – 0.05
0.93 to 1.15 –21.16
to 15.28 0.947
HCP
50
1.01x – 5.07
0.91 to 1.11 –22.03
to 11.02 0.967
22C
Lay
51
1.07x – 2.58
1.00 to 1.16 –14.25
to 8.12
0.969
HCP
51
1.04x – 1.37
0.99 to 1.10 –8.53
to 7.03
0.972
23B
Lay
101
1.00x + 2.60
0.95 to 1.04 –4.21
to 9.81
0.973
HCP
101
0.98x + 3.62
0.94 to 1.05 –4.91
to 11.17
0.960
Opr. = Operator; Lay = Lay User; HCP = Healthcare Professional
Passing and Bablok Regression Statistics / Pearson correlation