Performance evaluations, Precision, For healthcare professionals) low control solution – Bayer HealthCare Ascensia Contour Blood Glucose Monitoring System User Manual
Page 27
Precision
1. Laboratory Precision: To assess the repeatability (within-
run precision) of the Ascensia
®
C
ONTOUR
™
Blood Glucose
Monitoring System, 100 blood glucose readings (10
readings on each of 10 instruments) were obtained with
venous blood specimens at five glucose concentrations. The
following table summarizes the mean and pooled within-
Meter %CV at each level.
2. Control Testing Precision: Precision results were obtained
from duplicate assays of Control Solutions at two diabetes
clinics with the Ascensia C
ONTOUR
System. Testing was
performed over 63 days. People with diabetes and
healthcare professionals (HCP) at each clinic evaluated two
reagent lots. One lot was evaluated at both clinics. The
tables below show the combined results for the lay users
and HCPs. The overall standard deviations (SD) and
coefficients of variation (CV) include the within run and
between run / day variations.
23
Duplicate
Overall Overall
Reagent
Assays
Mean
SD
CV
Lot
Operator
(n = )
(mg/dL)
(mg/dL)
(%)
22B
HCP
(n = 1)
35
42.2
1.33
3.2
Lay User
(n = 51)
76
42.4
1.83
4.3
22C
HCP
(n = 4)
39
43.1
1.14
2.6
Lay User
(n = 53)
78
43.0
1.67
3.9
23B
HCP
(n = 5)
74
42.6
1.14
2.7
Lay User
(n = 104)
154
41.8
2.02
4.8
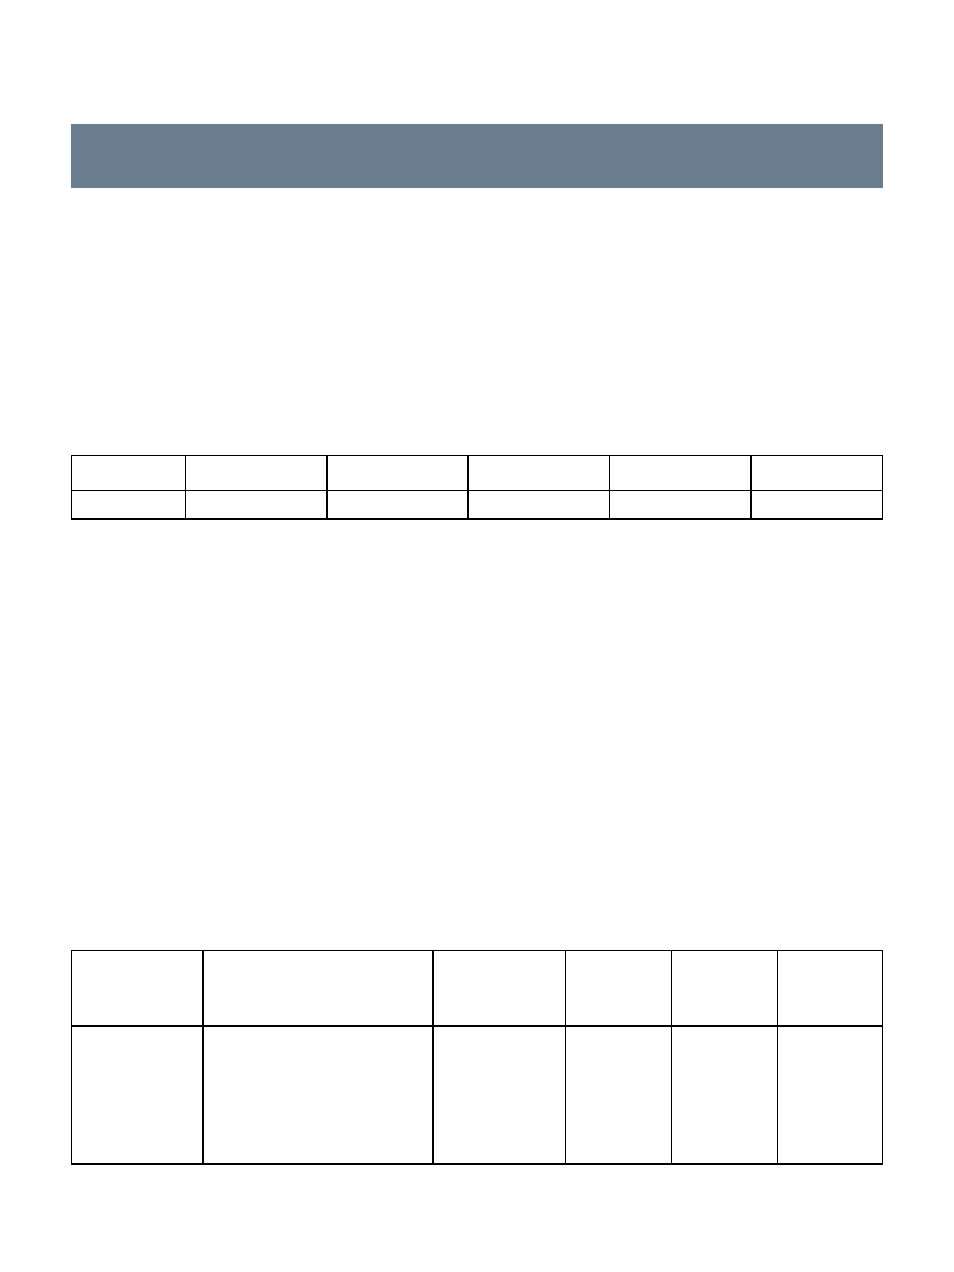
Performance Evaluations
(for Healthcare Professionals)
Low Control Solution
Mean
46 mg/dL
92 mg/dL
144 mg/dL
235 mg/dL
376 mg/dL
%CV
2.4%
2.5%
2.8%
3.1%
2.4%