Performance curves selection procedure, Oil temperature, Viscosity correction – Thermal Transfer Systems DF Series User Manual
Page 3
DF
262.554.8330
www.thermaltransfer.com
34
A
IR C
O
O
L
E
D
DF
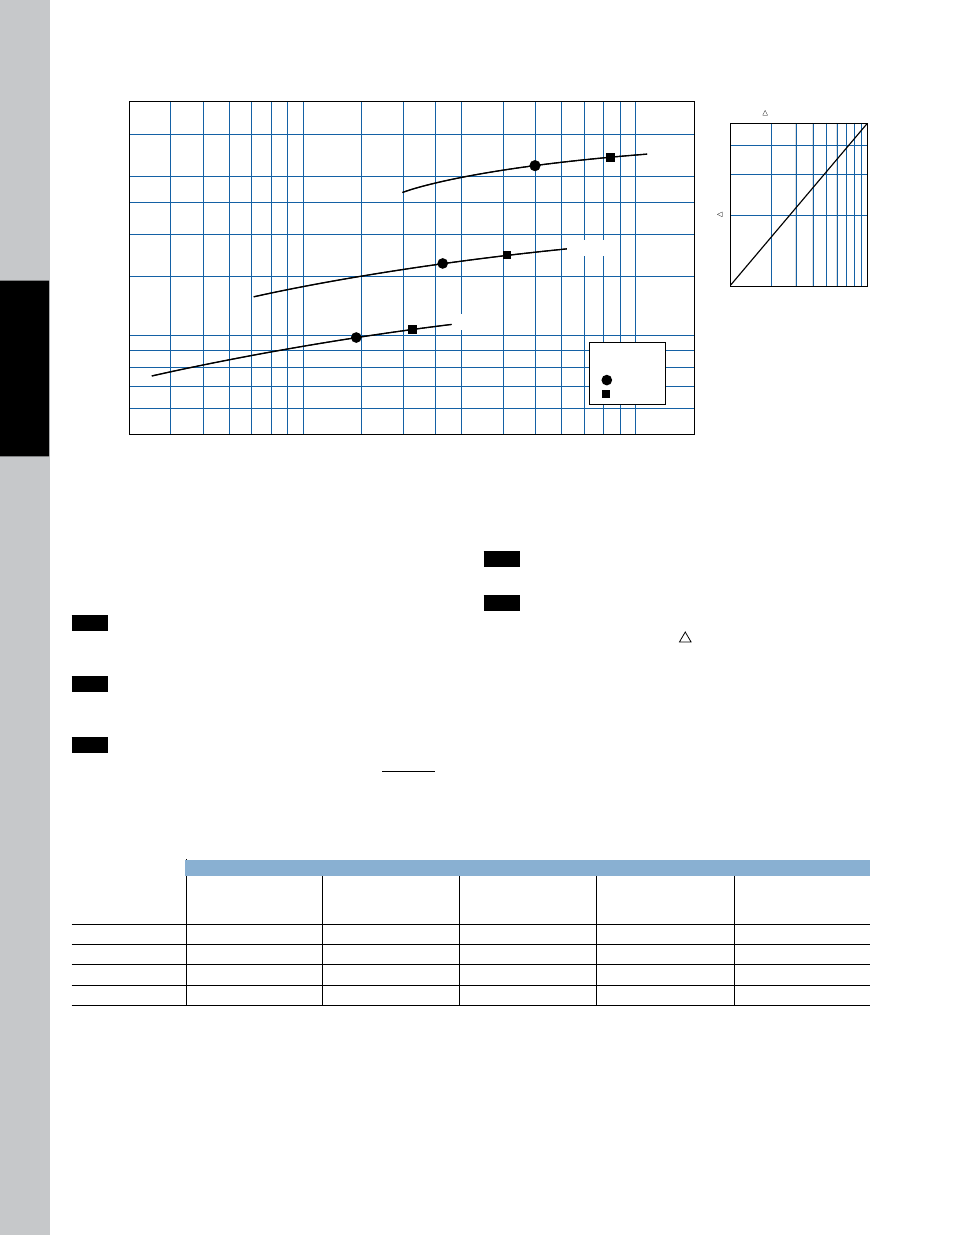
Performance Curves
Selection Procedure
Performance Curves are based on 50 SSU oil entering the cooler 50°F higher
than the ambient air temperature used for cooling. This is referred to as a
50°F E.T.D.
Step 1
Determine the Heat Load. Heat load may be expressed as either
horsepower or BTU/Hr. To convert horsepower to BTU/Hr.:
BTU/HR = Horsepower x 2545
Step 2
Determine Entering Temperature Difference. The entering oil
temperature is generally the maximum desired oil temperature.
Entering oil temperature – Ambient air temperature = E.T.D.
Step 3
Determine the Corrected Heat Dissipation to use the curves.
Corrected Heat Dissipation = BTU/HR heat load x 50°F x Cv
E.T.D.
50 60 70 80 90 100
200
400
300
500
150
OIL VISCOSITY - SSU
OIL
P MUL
TIPLIER
OIL
P CORRECTION CURVE
5
4
3
2
1
OIL PRESSURE
DROP
= 5 PSI
= 10 PSI
OIL FLOW - GPM
HEA
T DISSIP
ATION BTU/HR. A
T 50˚F E.T
.D.
3 4 5 6 7 8 9 10 15 20 25 30 40 50 60 70 80 90 100 150
50,000
40,000
30,000
25,000
20,000
15,000
10,000
9,000
8,000
7,000
6,000
5,000
DF - 11
DF - 12
DF - 22
Step 4
Enter curves at oil flow through cooler and curve heat dissipation.
Any curve above the intersecting point will work.
Step 5
Determine Oil Pressure Drop from Curves:
l
= 5 PSI; n = 10 PSI; Multiply pressure drop from curve by
correction factor found in oil
s
P correction curve.
Oil Temperature
Typical operating temperature ranges are:
Hydraulic Motor Oil
120°F - 180°F
Hydrostatic Drive Oil
160°F - 180°F
Engine Lube Oil
180°F - 200°F
Automatic Transmission Fluid
200°F - 300°F
C
V
Viscosity Correction
OiL
SAE 5
SAE 10
SAE 20
SAE 30
SAE 40
Average
110 SSU at 100°F
150 SSU at 100°F
275 SSU at 100°F
500 SSU at 100°F
750 SSU at 100°F
Oil Temp °F
40 SSU at 210°F
43 SSU at 210°F
50 SSU at 210°F
65 SSU at 210°F
75 SSU at 210°F
100
1.14
1.22
1.35
1.58
1.77
150
1.01
1.05
1.11
1.21
1.31
200
.99
1.00
1.01
1.08
1.10
250
.95
.98
.99
1.00
1.00
5
4
3
2
1
50
500
400
300
200
100
Oil P Correction Curve
Oil
P Multiplier
Oil Viscosity SSU