Performance curves, Selection procedure, Viscosity correction – Thermal Transfer Systems DH Series User Manual
Page 4
D
H
www.thermaltransfer.com
262.554.8330
31
A
IR C
O
O
L
E
D
DH
Performance Curves
DH-051
DH-073
DH-095
DH-084
DH-117
DH-194
DH-205
DH-216
DH-106
DH-227
DH-513
DH-249
DH-348
DH-337
DH-524
DH-326
DH-359
DH-535
DH-425
DH-370
DH-626
DH-447
DH-670
1 1.5 2 2.5 3 4 5 6 7 8 9 10 15 20 25 30 40 50 60 70 80 90 100 150 200
200,000
150,000
100,000
90,000
80,000
70,000
60,000
50,000
40,000
30,000
25,000
20,000
15,000
10,000
9,000
8,000
7,000
3,000
2,500
2,000
HEA
T DISSIP
ATION BTU/HR @ 50˚F E.T
.D.
OIL FLOW - GPM
OIL PRESSURE
DROP
= 5 PSI
= 10 PSI
= 20 PSI
DH-062
5,000
6,000
4,000
.1
400
.2
.3
.4
.5
.25
.6
.7
.8
.9
1.0
2.0
2.5
3.0
4.0
500 600 700 800 1000
2000
1.5
.15
1500
2500
3 ROW
2 ROW
1 ROW
Ambient Air
P - Inches of W
ater
5
4
3
2
1
50 60 70 80 90 100
200
400
300
500
150
Oil P Correction Curve
Oil
P Multiplier
1.0
.9
.7
.6
.5
Face Velocity SFPM
Oil Viscosity SSU
Face Velocity SFPM
Air Velocity Correction Curve
Air Static Pressure Drop
.8
1.5
400
500 600 700
2.0
800 1000
1500
2000 2500
Correction Factor
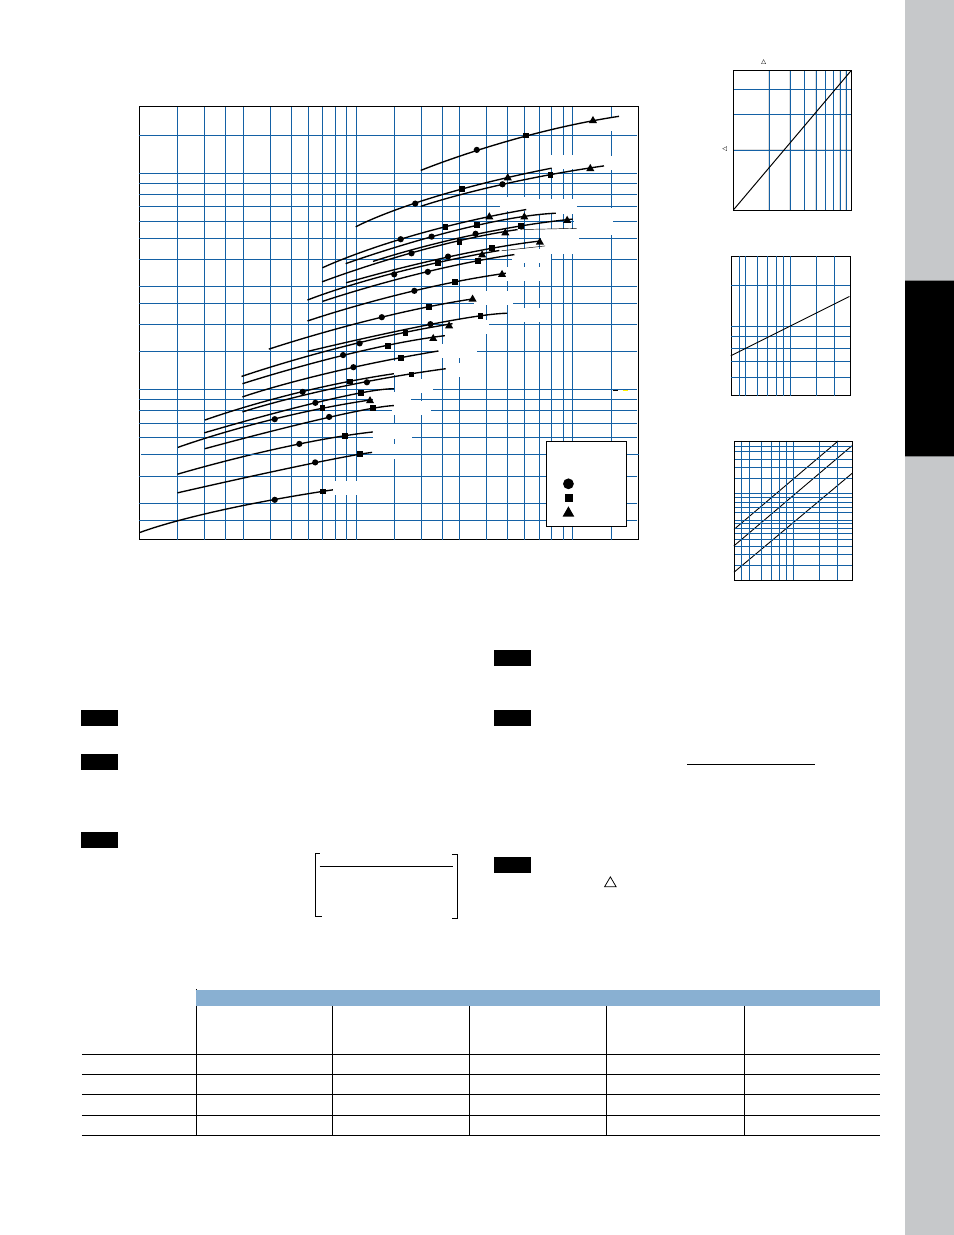
Step 4
Enter the Performance Curves at the bottom with the GPM oil
flow and proceed upward to the adjusted heat load from Step 3.
Any curve on or above this point will meet these conditions.
Step 5
Calculate actual SFPM Air Velocity or SCFM (Standard Cubic
Feet Per Minute) using the Face Area from the table.
A. SFPM Air Velocity* =
SCFM Air Flow
Square Feet Face Area
B. SCFM Air Flow = SFPM Air Velocity x Square Feet Face Area
*If the Air Velocity calculated is different than the value in Step 3,
recheck Corrected oil Pressure Drop.
Step 6
Multiply Oil Pressure Drop from curve by correction factor
found in Oil
s
P Correction Curve.
Performance Curves are based on 50 SSU oil, 1000 Standard Feet per Minute
(SFPM) Air Velocity, and a 50°F Entering Temperature Difference (E.T.D.)
E.T.D. = Entering oil temperature - Ambient air temperature
Step 1
Determine Heat Load: Heat load may be expressed as either
Horsepower or BTU/Hr. BTU/Hr. = Horsepower x 2545
Step 2
Determine entering temperature difference: The entering
oil temperature is generally the maximum desired system
temperature. E.T.D. = Entering oil temperature - Ambient air
temperature.
Step 3
Determine the corrected heat dissipation to use the curves:
Corrected
BTU/Hr.
50°F x Cv
Heat Dissipation
=
(Heat Load)
x
Desired
Air Velocity
E.T.D. x Correction
Factor
Selection Procedure
C
V
Viscosity Correction
OiL
SAE 5
SAE 10
SAE 20
SAE 30
SAE 40
Average
110 SSU at 100°F
150 SSU at 100°F
275 SSU at 100°F
500 SSU at 100°F
750 SSU at 100°F
Oil Temp °F
40 SSU at 210°F
43 SSU at 210°F
50 SSU at 210°F
65 SSU at 210°F
75 SSU at 210°F
100
1.14
1.22
1.35
1.58
1.77
150
1.01
1.05
1.11
1.21
1.31
200
.99
1.00
1.01
1.08
1.10
250
.95
.98
.99
1.00
1.00
*Note: If air velocity is unknown assume 750 SFPM.
5
4
3
2
1
50
500
400
300
200
100
Oil P Correction Curve
Oil
P Multiplier
Oil Viscosity SSU