4 configure tab controls – INFICON STM-1 LabView Manual User Manual
Page 4
The ZERO THICKNESS button will cause the STM-1 to equate its current frequency reading to a thickness of zero. Any new
mass accumulation on the crystal will create a thickness reading rising from zero.
The CLEAR CHARTS button will erase the data buffers of the rate and thickness graphs.
The RATE AVERAGE control, when off, will cause the graph to display the raw rate reading determined by the crystal frequency
measurement. When on, the VI will display the record XtalRate_F, a time averaged version of the raw rate.
The time scale of both the rate and thickness graphs can be adjusted using the TIME RANGE controls.
The TOOLING control will indicate the tooling factor for the STM-1 unit indicated on the CONFIGURE panel, and will allow
the user to alter this value. The tooling factor is used as a correction factor to compensate for differences between the location of
the sensor and the location of the substrate. A value of one is appropriate when the sensor and substrate have equal coverage.
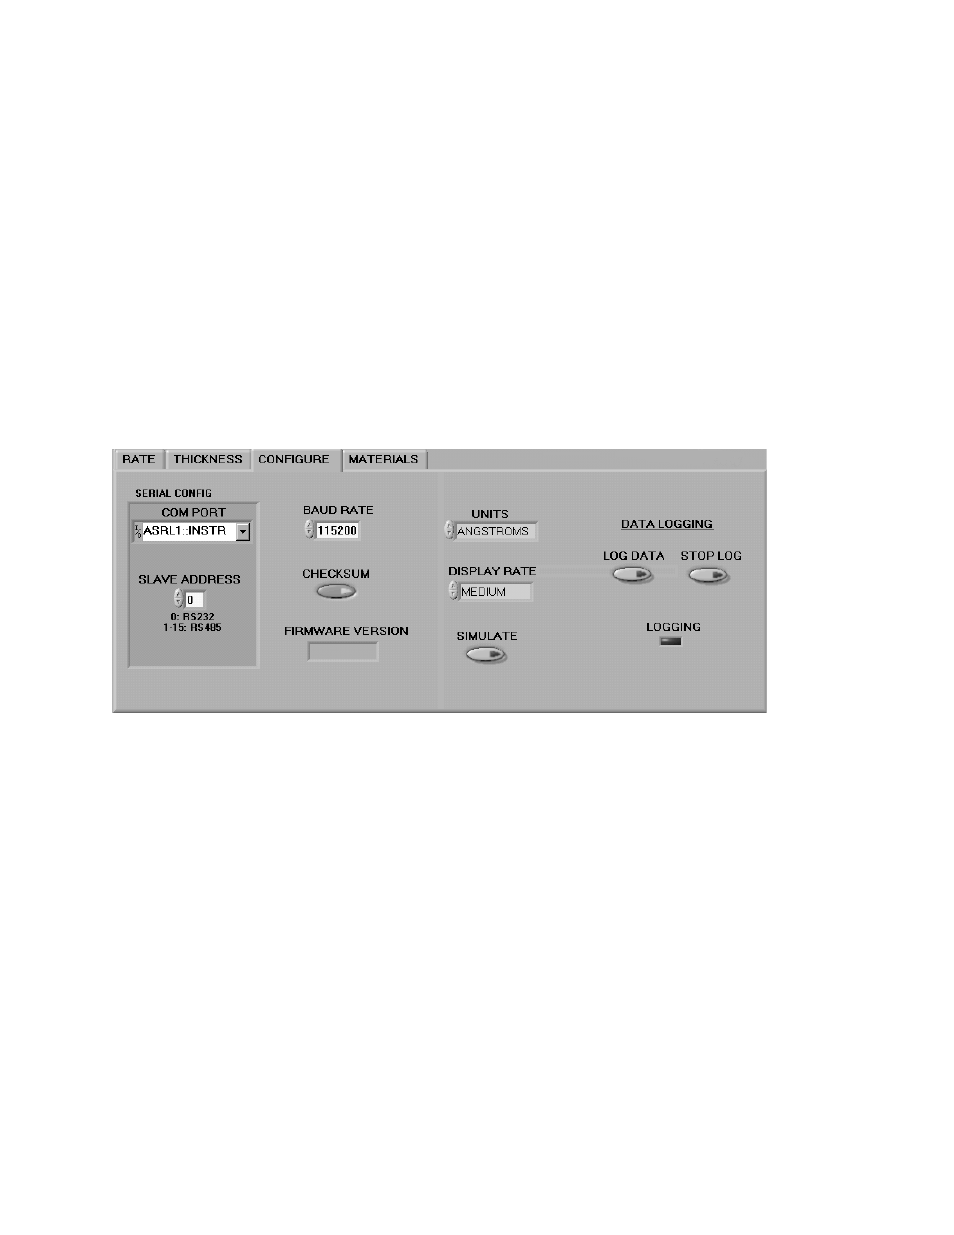
1.4 Configure Tab Controls
The COM PORT, SLAVE ADDRESS, BAUD RATE, and CHECKSUM must all match the settings of the STM-1 card
attached before the VI can be run successfully. For each possible combination of COM PORT and SLAVE ADDRESS, a
separate value of BAUD RATE and CHECKSUM are stored. If multiple units are to be communicated with at different com
ports or slave addresses, the configuration for each needs to be done before the vi is started. Alternatively, when running , the vi
can be placed in simulate mode so that alternate COM PORT and SLAVE ADDRESS settings can be reached and configured
without causing a communication error.
The FIRMWARE VERSION indicator shows the version of software running on the connected STM-1 unit.
The UNITS control allows the user to select thickness in Angstroms, or mass per unit area in micrograms per square centimeter.
DISPLAY RATE is a control that will determine how often the digital display at the top of the panel is updated. While the graphs
are updated each time the VI receives data from the STM-1, by default the digital displays are not. Different speeds are offered to
allow the user time to read and comprehend the values. Each update of the digital display will be an average of the values
received from the STM-1 since the last update, Hence a very sudden change in value, such as a zeroing of thickness, may take a
couple of updates to become apparent in the digital display, even though it can be seen in the graph immediately.
The SIMULATE button gives the ability to operate the VI without having a STM-1 card attached. The VI will use simulated
values for rate and thickness, but otherwise operate as if a STM-1 card were present.
The LOG DATA button will launch two dialog boxes. One, a standard windows file selection box, is to be used by the user to set
a file name to log to. The other allows the user to set the frequency with which readings are logged, the contents of each log, and
whether to start the logging immediately (with the push of the OK button) or to wait for the next time the ZERO THICKNESS
button is pressed to begin.
4