Axcess e/OLS User Manual User Manual
Page 10
O N L I N E S U P E R V I S O R U S E R ’ S M A N U A L
©AXCESS INTERNATIONAL, Inc
750.015.001 R00
7
5/4/2007
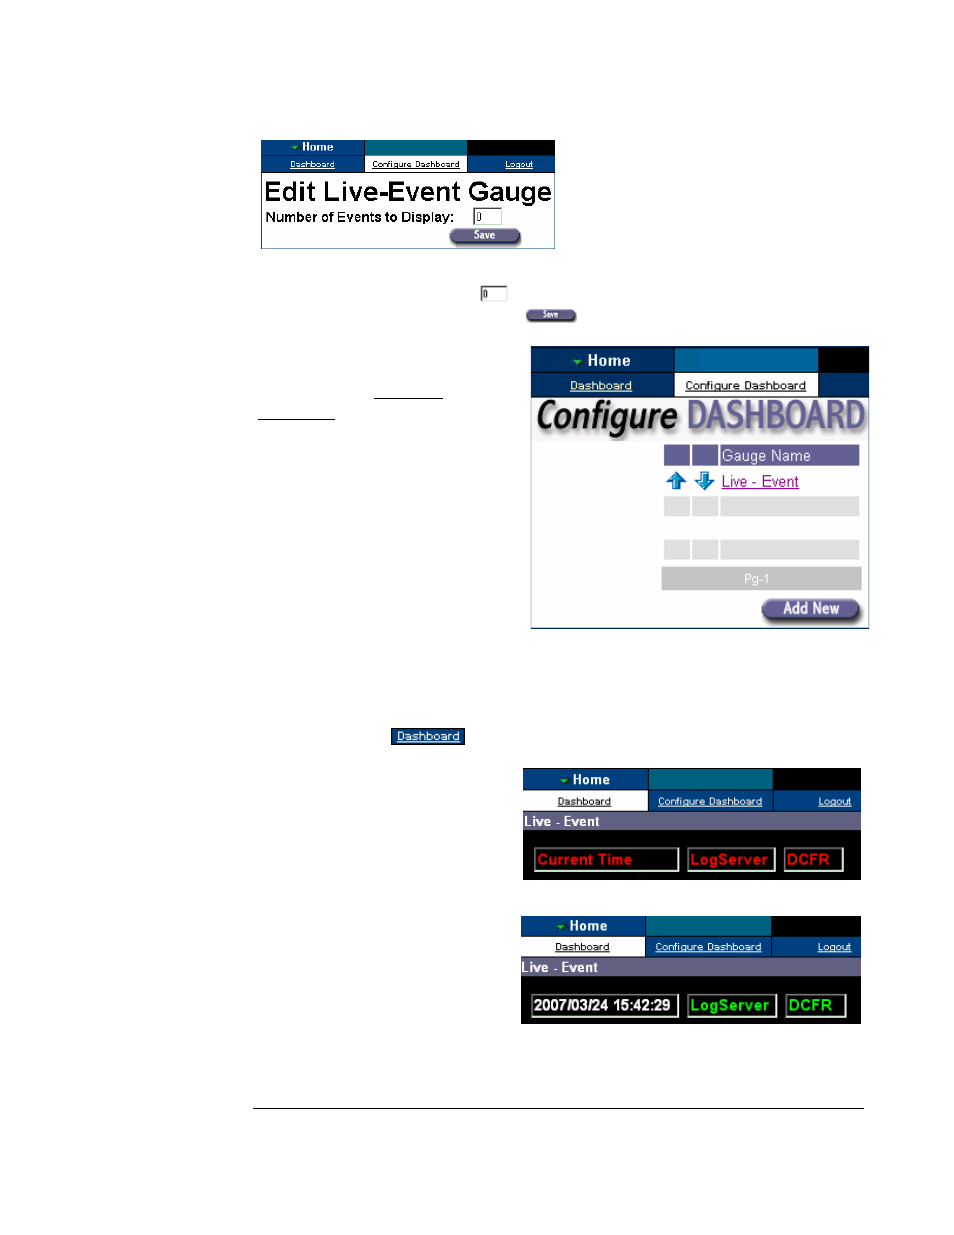
Figure 2.5 Edit box at “0”in the Edit Live-Event Gauge
In the edit box we see a zero.
The range of the edit box is 0 through 20. Enter a
number within the range and click the
button.
Figure 2.6 Live-Event gauge created.
Recall figure 0. The OLS Logger on the User ‘s machine must connect with the
DCFR service and the LogServer Service, in order to view “Live-Events”, and access
the database. Let us look at the “Live-Event” gauge we’ve created. With respect to
figure 2.6, click on
to view the “Live-Event” gauge.
Figure 2.7 Live-Events initially connecting
Figure 2.8 Client connected to distributed services
Recall in figure 0 that RFID events are entered
After clicking the “Save” button, as
in figure 2.5, the Configure
Dashboard submenu should now
exhibit the gauge name of “Live-
Event”. Note, if we now clicked the
“Add New” button, in figure 2.6, the
drop-down menu that we saw in
figure 2.3 would appear and we
would be ready to add another gauge.
Also, if you have the proper
permission, you may edit the “Live-
Event” gauge here.
In figure 2.7, the
Current Time
will be the local machine’s time.
The red flashing
LogServer
and
DCFR
indicate that the client
machine is trying to connect to
these services. A connection is
indicated by a solid green
LogServe
r
and
DCFR
, as in figure
2.8. As a general rule, items colored
red in OLS require attention.