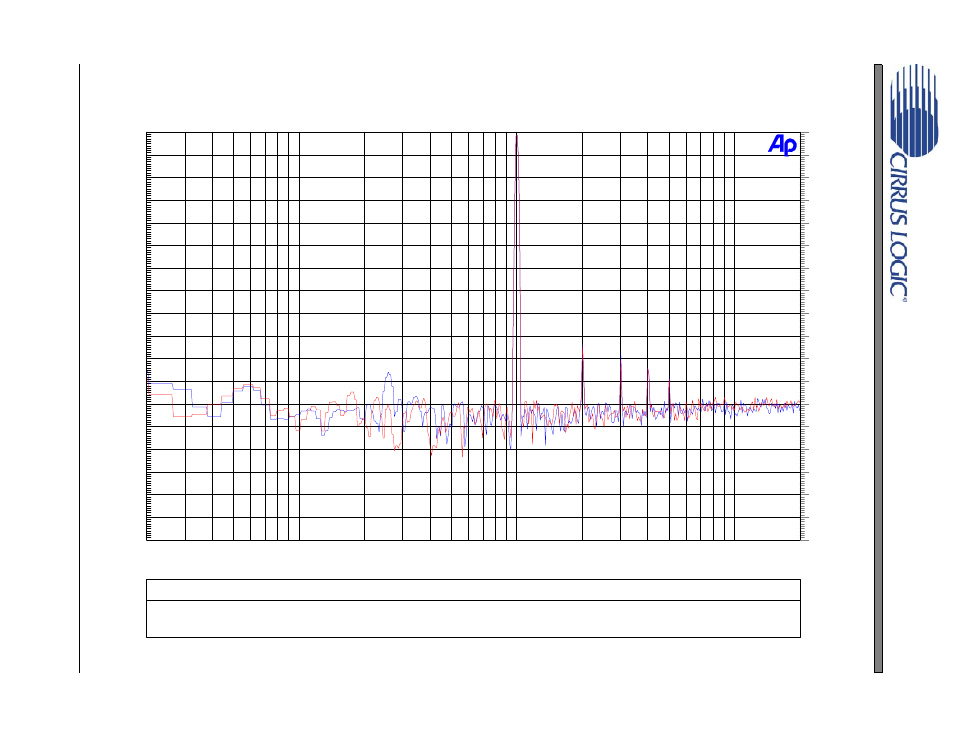
2 fftlm, Figure 18. fft from cdb5343 output, Cdb5343 – Cirrus Logic CDB5343 User Manual
Page 13
DS68
7DB2
13
CDB5343
13.2
FFTlm
shows a typical FFT of the output from the CS5343 on the CDB5343 with a 2 Vrms, 1 kHz sinewave input. For this plot, the device was
configured for Single-Speed Mode with VA = 5 V.
Figure 18. FFT from CDB5343 Output
Color
Sweep
Trace
Line Style
Thick
Data
Axis
Comment
1
1
Blue
Solid
1
Fft.Ch.1 Ampl
Left
1
2
Red
Solid
1
Fft.Ch.2 Ampl
Right
-180
+0
-170
-160
-150
-140
-130
-120
-110
-100
-90
-80
-70
-60
-50
-40
-30
-20
-10
d
B
F
S
-180
+0
-170
-160
-150
-140
-130
-120
-110
-100
-90
-80
-70
-60
-50
-40
-30
-20
-10
d
B
F
S
20
20k
50
100
200
500
1k
2k
5k
10k
Hz
CS5343 FFT, 1 kHz Full-scale Input, VA = 5 V, SSM Master Mode
See also other documents in the category Cirrus Logic Hardware:
- CobraNet (147 pages)
- CS4961xx (54 pages)
- CS150x (8 pages)
- CS1501 (16 pages)
- CS1601 (2 pages)
- CS1601 (16 pages)
- CS1610 (16 pages)
- CRD1610-8W (24 pages)
- CRD1611-8W (25 pages)
- CDB1610-8W (21 pages)
- CS1610A (18 pages)
- CDB1611-8W (21 pages)
- CDB1610A-8W (21 pages)
- CDB1611A-8W (21 pages)
- CRD1610A-8W (24 pages)
- CRD1611A-8W (25 pages)
- CS1615 (16 pages)
- AN403 (15 pages)
- AN401 (14 pages)
- AN400 (15 pages)
- AN375 (27 pages)
- AN376 (9 pages)
- CRD1615-8W (22 pages)
- CRD1616-8W (23 pages)
- AN402 (14 pages)
- AN404 (15 pages)
- CRD1615A-8W (21 pages)
- CS1615A (16 pages)
- CS1630 (56 pages)
- AN374 (35 pages)
- AN368 (80 pages)
- CRD1630-10W (24 pages)
- CRD1631-10W (25 pages)
- CS1680 (16 pages)
- AN405 (13 pages)
- AN379 (31 pages)
- CRD1680-7W (31 pages)
- AN335 (10 pages)
- AN334 (6 pages)
- AN312 (14 pages)
- AN Integrating CobraNet into Audio Products (16 pages)
- CobraNet Audio Routing Primer (9 pages)
- Bundle Assignments in CobraNet Systems (3 pages)
- CS2300-01 (3 pages)
- CS2000-CP (38 pages)